In this nugget we look at NOAA active region 10955 which emerged in the southern hemisphere on 6th May 2007 and showed some interesting flows before a GOES B-class flare.
The flaring in this active region appears to be linked to a small bipole which emerged into the active region. Flaring began approximately seven hours after the flux emergence began and continued until the all the flux had cancelled (
Wallace et al. 2010, submitted). A flare is often preceded by some initial energy release that has been observed as small-scale brightenings in radio (
Kai et al. 1983;
Fárník et al. 2003), H-alpha (
Contarino et al. 2003), EUV (
Warren and Warshall 2001) and X-ray spectral bands (
Fárník et al. 1998). Where there is flux emergence, the pre-flare brightenings occur where with the flux is emerging and cancelling (
Sakajiri et al. 2004;
Schmieder et al. 2006;
Chifor et al. 2007).
The profile of coronal lines shows non-thermal broadenings which increase tens of minutes before the flare (
Doschek et al. 1980;
Harra et al. 2001;
Asai et al. 2006;
Harra et al. 2009). This increase in line widths can be caused by magnetic reconnection, turbulence or waves in the corona (see
EIS Nugget on 1 March 2010 for more on line widths). In addition to all this pre-flare activity, EIS is revealing new observations.
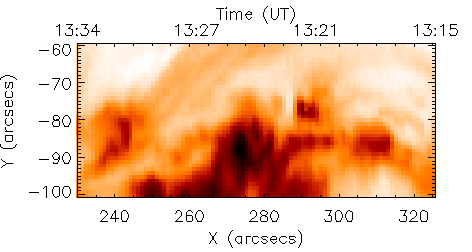
Figure 1: Reverse colour image showing the intensity in He II 256.32 Å line.
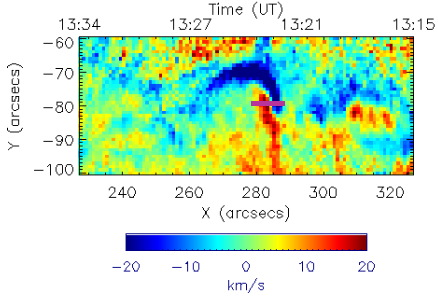
Figure 2: Doppler velocity in He II 256.32 Å line.
In this event we see strong and oppositely directed flows near the location of the flaring.
Figures 1 and
2 show He II (256.32 Å) data taken with the 1" slit on 12th May. The figures show the core of the active region 20 minutes before the onset of a B-Class flare at 13:38 UT 12 May. EIS rasters from west to east and the timings of the slit position are displayed on the top axis. Figures 1 shows the He II intensities and Figures 2 the Doppler velocities, with plasma motion away from (towards) the observer in blue (red). Although the structures are very faint in the intensity image, there is a strong red and blue shift of approximately ±30 km/s at the centre of the velocity map. The velocity profile along the purple bar is plotted in Figures 3, below.
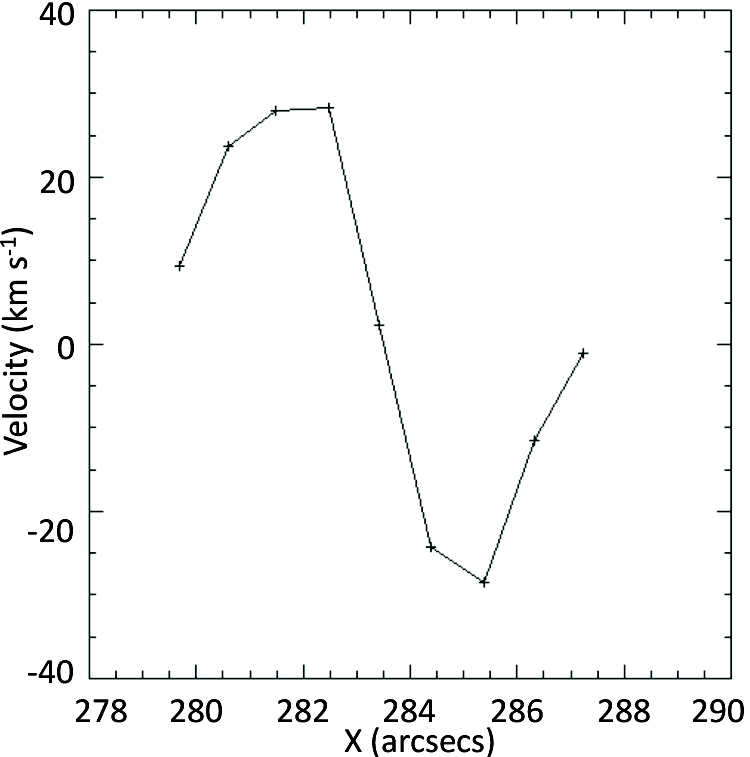
Figure 3: Doppler velocities along the purple bar in Figure 2.
The velocity profile is reminiscent of that seen in a filament observed by Williams et al. 2009. They saw anti-symmetric velocities on either side of the filament's axis, shortly before the onset of a flare. This motion is consistent with the rotation of the filament due to the MHD helical kink instability. However, the velocities observed here are in the range of ±30 km/s, much higher than those found by Williams of ±10 ~ 20 km/s along the centre of the filament.
One of the main differences between the two observations is that in this example there is no dark filamentary material seen at the location of the flows. Instead, the blue-shifted structure corresponds to the location of a loop which is bright in the TRACE 171 Å waveband. Flows are observed along the bright loop structure and could be evidence for reconnection between this loop and magnetic flux connected to the emerging bipole. As this reconnection proceeds, the loop fills with plasma and expands. Finally the reconnection rate increases producing the B-class flare.
It is important to study the pre-flare activity to gain an understanding of the flare trigger mechanisms. The extended solar minimum has provided the opportunity to observe small GOES A or B-class flares in relatively simple active regions that, at least in theory, may be more easily understood with sufficiently sensitive measurements. The improved spatial and spectral resolution of Hinode enables us to look for activity simultaneously across a broad range of wavelengths and at small scales, enabling us to study pre-flare activity in unprecedented detail.
If you are interested in looking for similar data or other pre-flare signatures we recommend EIS study 286. Full details can be found at: /SolarB/ShowEisStudy.jsp
Or contact Alison Wallace at ajw2 'at' mssl.ucl.ac.uk for more information.