Coronal hole (CH) boundaries are the interface between a CH, where the field is dominantly
"open" to interplanetary space, and the surrounding corona where the magnetic field is mainly
closed. While CHs are long established to be a source of the fast solar wind, the CH boundaries
have been proposed as one of the sources of the slow solar wind (ref. 1). The recent launch of
the Extreme-Ultraviolet Imaging Spectrometer (EIS) aboard Hinode, has provided the means to
investigate bulk plasma flows and non-thermal motions at quiet sun-coronal hole boundaries with
an unprecedented high spectral resolution and large field of view.

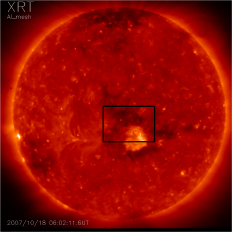
Figure 1: Hinode XRT full-disk image on 18 October 2007. The box indicates the EIS
field of view that captures the upper part of an active region that has emerged inside an equatorial
coronal hole.
On 18th of October 2007, Hinode observed an active region embedded in an equatorial coronal
hole. The X-ray full-disk image in
Figure 1 (see left), shows that the northern half of the
active region-coronal hole complex is captured by EIS as indicated by the black box. EIS scanned
this region from Solar-West to -East over 460 pointing positions at 1 arcsec intervals. Each exposure
was 40 seconds per position and the whole scan was completed between 00:18 UT and 05:23 UT.
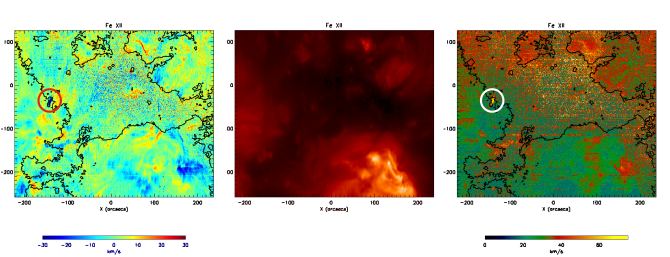
The Fe XII 195 Å intensity image of the scan is shown in the middle panel of
Figure 2. The
corresponding doppler velocity map with a coronal hole contour overlaid is shown beside it, in the
left panel. Blue-shifted outflows are visible at the periphery of the active region in the South-West.
The outflow velocities range from 5 to 20 km/sec. However, the strongest outflows within the EIS
field of view occur along the boundary between the quiet sun and coronal hole, with the maximum
outflow velocity of 65 km/sec indicated by the red circle to the east. This is interesting because we
would expect flows at the edges of the active region to be stronger given its strong magnetic field
and the large-scale processes that are at work. Spatially coincident with the strongest outflows is
the greatest non-thermal line broadening as shown in the non-thermal velocity map in the right
panel of
Figure 2. Non-thermal velocities exceeding 80 km/sec are designated by the white circle.

Figure 2: Hinode EIS Fe XII 195 Å scan (T = 1.3 MK) corresponding to the black box in Figure 1:
left: velocity map, middle: intensity map, right: non-thermal velocity map. The CH boundary has
been overlaid on the velocity and non-thermal velocity maps (see Attrill et al. 2008 (ref. 2) for method).
The strongest outflows of -65 km/sec (inside the red circle of the left panel) and non-thermal line
broadening of 80 km/sec (inside the white circle of the right panel) occur at the quiet-sun - coronal
hole boundary.
It has been suggested that the unique magnetic configuration found at CH boundaries, characterized by the
juxtaposition of 'open' and closed field, is believed to be favourable for magnetic reconnection known as interchange reconnection (ref. 3).
The data presented here, by processing EIS data to extract spectral information, may help us to understand this process.
Specifically, the location of increased non-thermal velocity as an indicator of turbulence due to reconnection,
could provide evidence that this process is taking place.
References:
1.
Fisk, L.A., Zurbuchen, T.H., Schwadron, N.A., 1999, Astrophys. J., 521, 868
Fisk, L.A., Schwadron, N.A., 2001, Astrophys. J., 560, 425
Schwadron, N.A., 2002, Geophys. Res. Lett., 29, 10.1029/2002GL015028
Schwadron, N.A., McComas, D.J., Elliott, H.A., Gloeckler, G., Geiss, J., Von Steiger, R., 2005, J. Geophys. Res., 110, A04104
2.
Attrill, G.D.R.A., van Driel-Gesztelyi, L., Demoulin, P., Zhukov, A. N., Steed, K., Harra, L.K., Mandrini, C.H., Linker, J., 2008, Sol. Phys., 252, 349
3.
Crooker et al. 2002, J. Geophys. Res., 107, 1028


