EIS observed indicators of push-mode magnetic reconnection that is crucial in the largest flare in solar cycle 24
Yumi Bamba - Institute for Advanced Research/Nagoya University
An X9.3-class solar flare, the largest event in solar cycle 24, and its preceding X2.2-class flare occurred on 6th September 2017 in the solar active region NOAA 12673. Hinode successfully observed these X-class flares with its three instruments and, among others, EIS perfectly covered the central region of the flaring site. We investigated the local Doppler velocities of plasma related to the precursor brightening using the data from EIS and other instruments.
Our analysis on the data from Hinode/SOT and XRT, SDO/HMI and AIA, and nonlinear force-free field modeling suggests that the intrusion of peninsula-shaped negative polarity, which is indicated by the red circle in Figure 1(a), toward the neighboring opposite-polarity region (P1) in the northwest plays an important role in triggering the consecutive X-class flares. The intrusion is crucial to the promotion of 'push-mode' magnetic reconnection (Yamada 1999) of sheared magnetic fields along the polarity inversion line within the major bipole P1-N1, which results in the formation of a twisted magnetic flux rope. The push-mode reconnection can occur on a vertical electric current sheet formed between large-scale sheared magnetic fields by converging flows, and flux cancellation (van Ballegooijen & Martens 1989; Green et al. 2011) in the photosphere accompanies it. In this AR, the push-mode magnetic reconnection likely forms a small magnetic loop connecting P1 and N1 at the tip of the intruding negative peninsula.
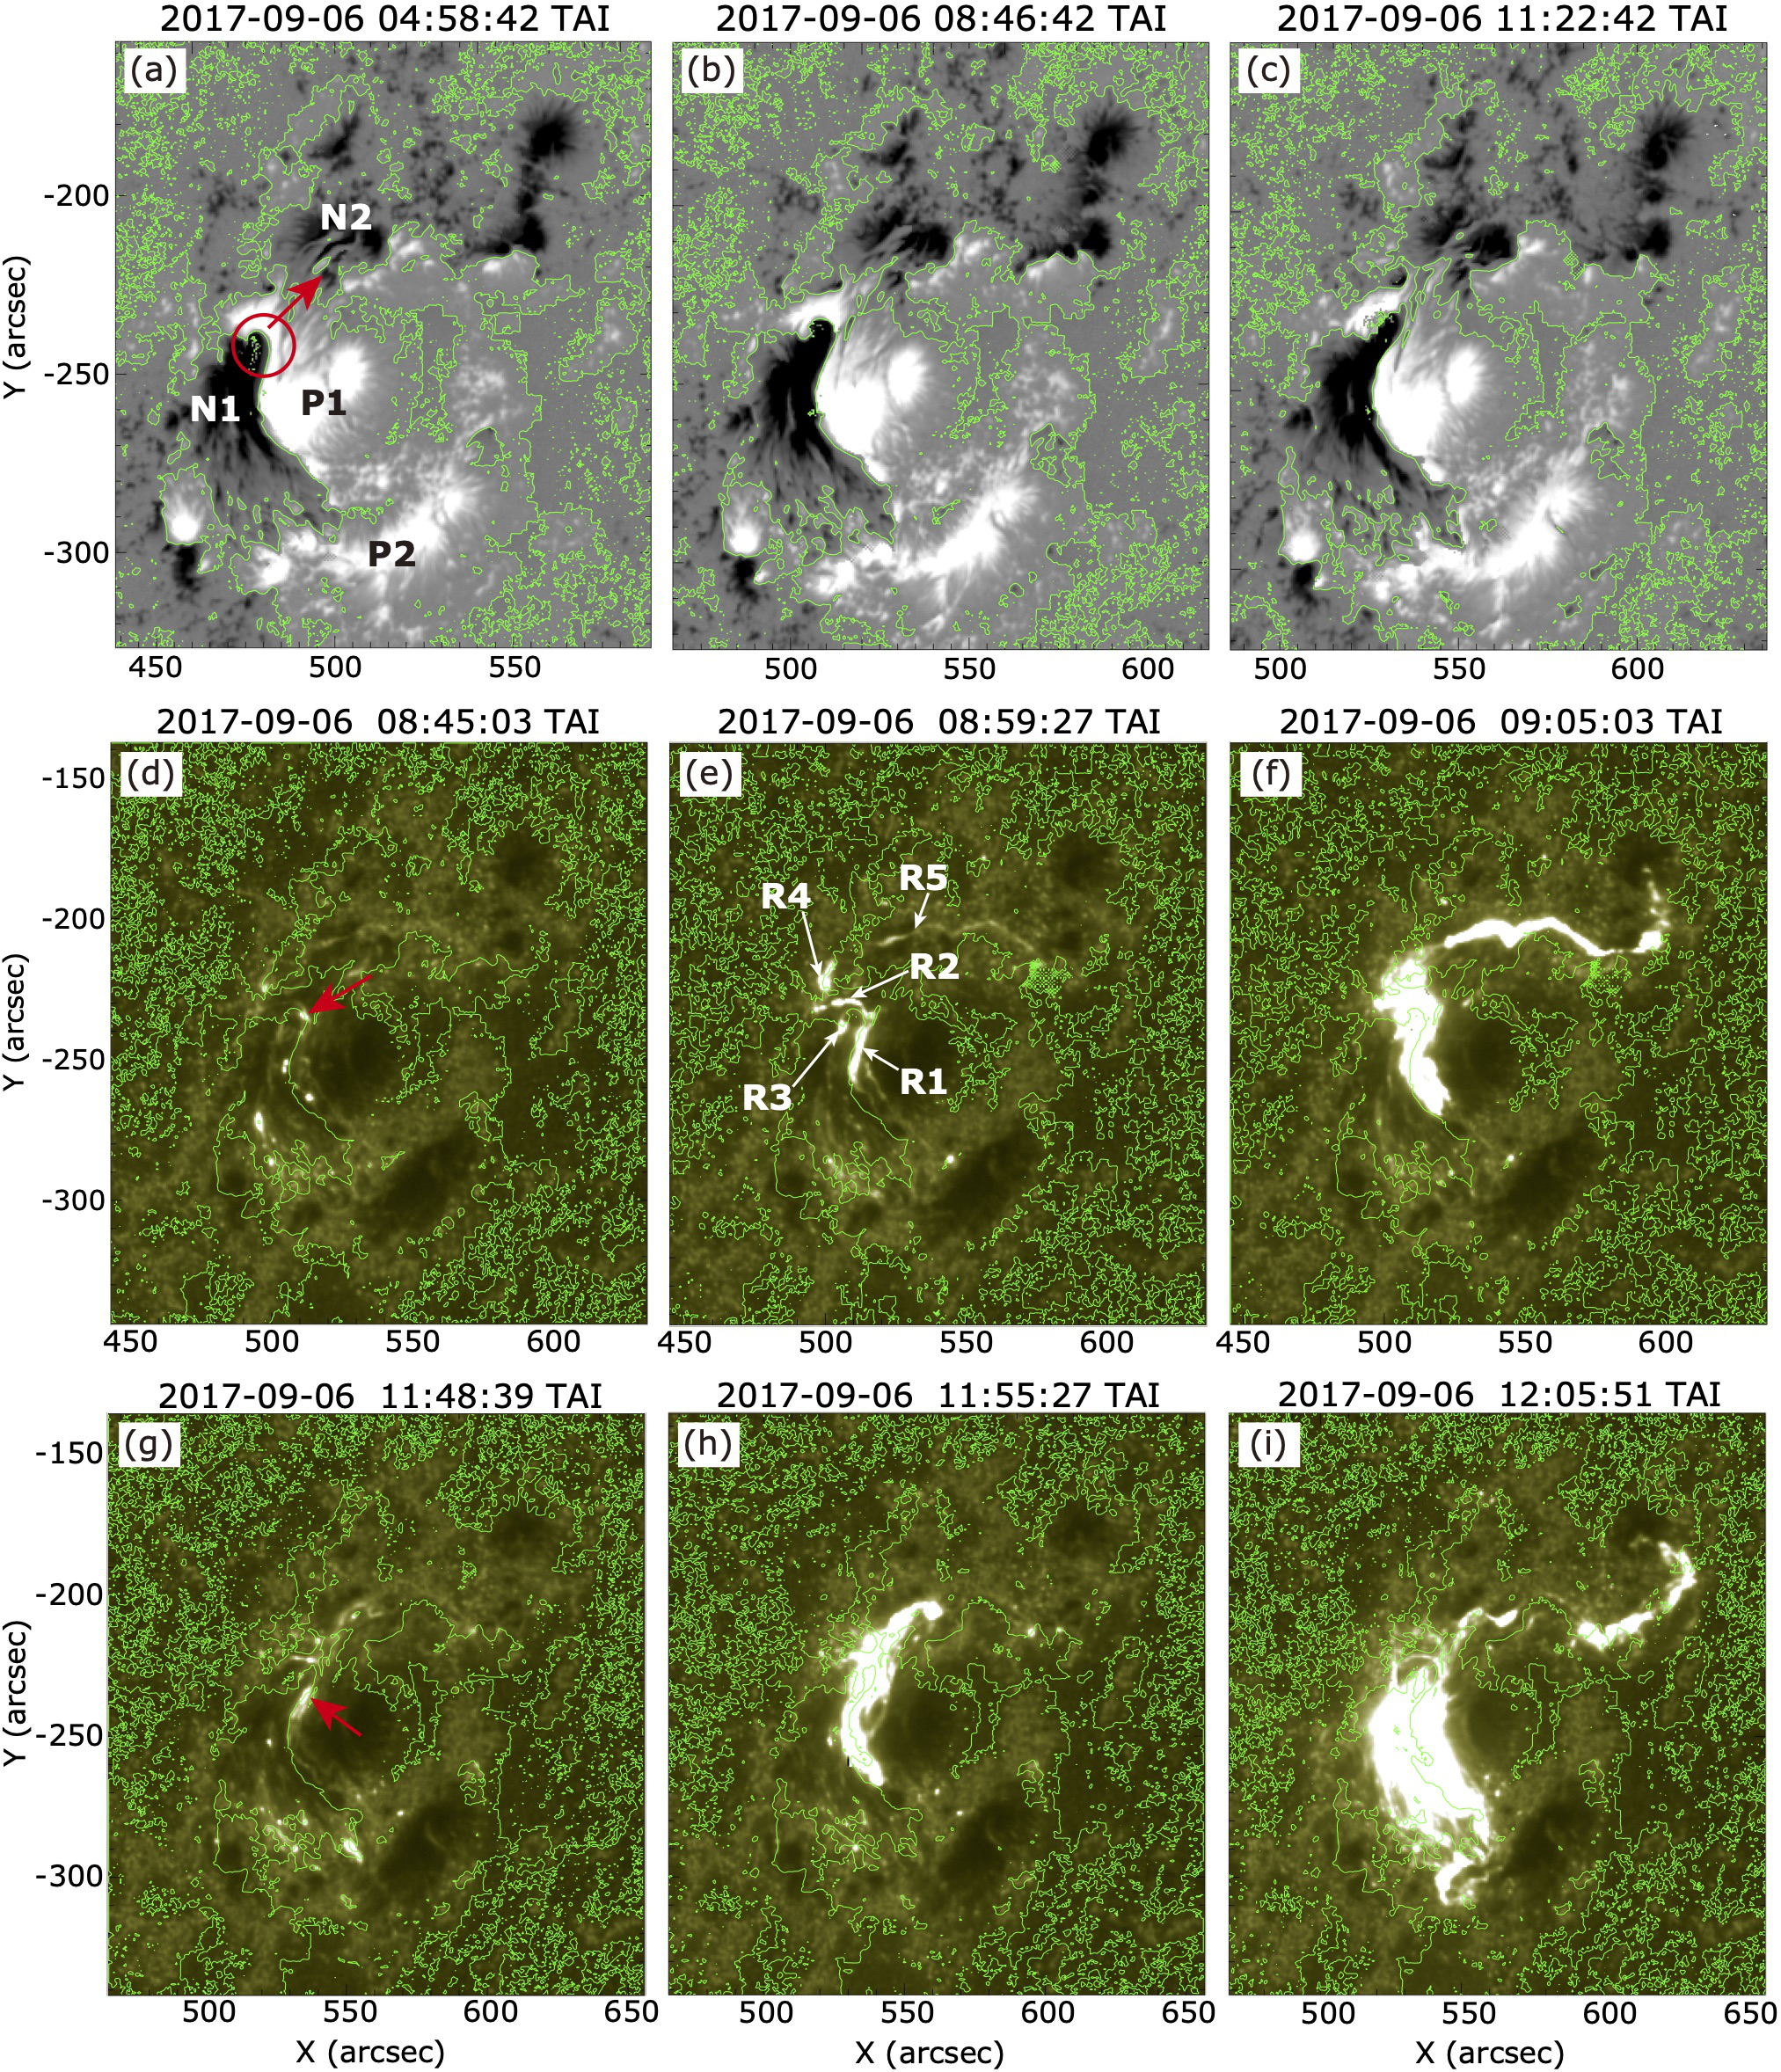
Figure 1: (a-c) Temporal evolution of the radial magnetic field Bz observed by SDO/HMI. The background white/black areas indicate the positive/negative polarities of Bz, and the magnetic polarity inversion lines are indicated by the green lines. (d-i) Temporal variation of brightening in SDO/AIA 1600 Å. The left, middle, and right columns depict snapshots of the precursor brightening, initial flare ribbons, and enhanced flare ribbons, respectively. Panels (d)-(f) and (g)-(i) correspond to the X2.2 and X9.3 flares, respectively.
An interesting cusp-shaped brightening was observed by EIS at the tip of the intruding negative peninsula (i.e., at the location of the push-mode reconnection) approximately 1.5 hr before the onset of the X2.2 flare as seen in Figure 2(b). The brightening starts in a small region indicated by the white arrow in SDO/AIA 171 Å image (Figure 2(e)) and propagates to both sides; then, the cusp-shaped brightening appears (Figure 2(e)-(i)). This suggests that there is an energy input at the top of the cusp and plasma fell down along the magnetic field lines. Moreover, a transient but significant downflow is observed to the west of the intruding negative peninsula, as shown in Figure 2(c). This redshifted signal coincides with the western footpoint of the cusp-shaped brightening, whereas in Figure 2(d), a significant line broadening is observed to exhibit a cusp-shaped structure.
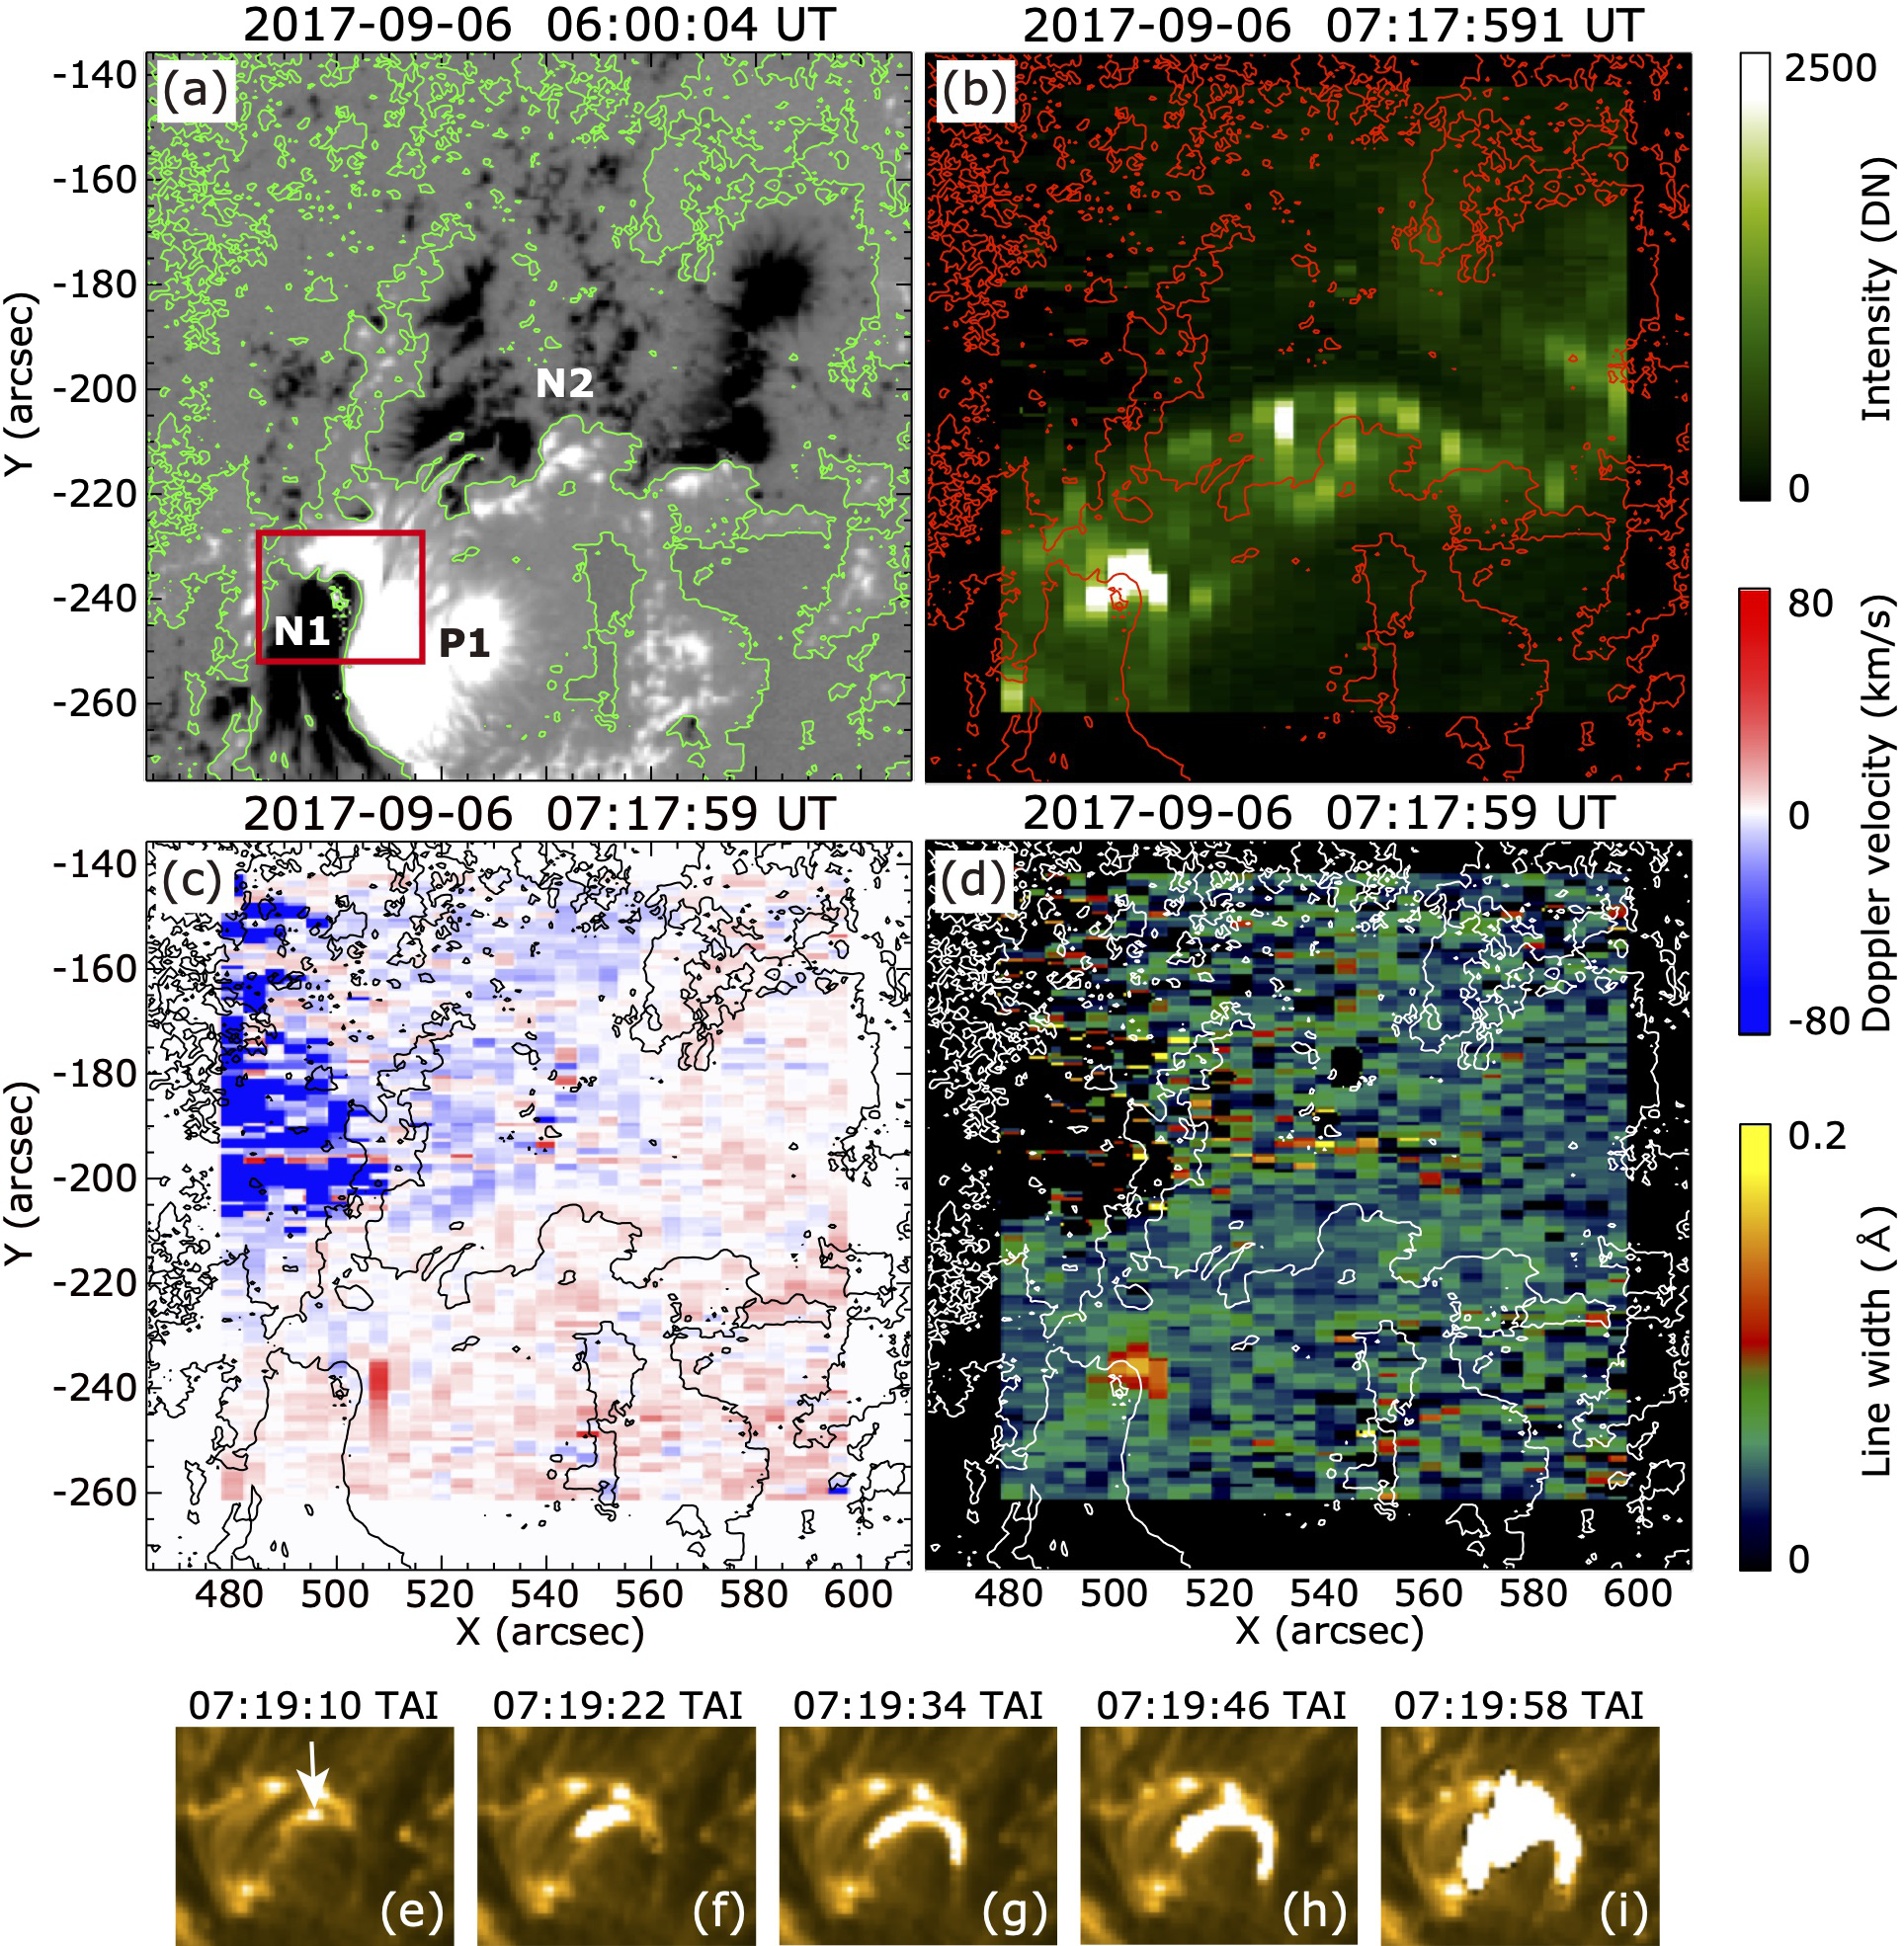
Figure 2: (b) Intensity, (c) Doppler velocity, and (d) line width of the Fe XIV (264.7 Å) line observed by EIS in comparison to the reference Bz magnetogram of panel (a). The contour in each panel indicates the magnetic polarity inversion lines. Temporal evolution of the small cusp-shaped brightening in panel (b) is depicted in panels (e)-(i), which are coronal images captured by SDO/ AIA 171 Å in the field of view of the red rectangle in panel (a).
Figure 3 shows the spectral line profiles and spectral images of Fe XIV (264.7 Å and 274.2 Å ), FeXVI/ Fe XXIII (263.3 Å), and He II (256.3 Å) lines around the redshifted region in Figure 2(c). Evidently, the two Fe XIV spectra (Figure 3(a-1) and (b-1)) have significantly redshifted components (red-colored profiles), whose Doppler velocities relative to the primary components (blue profiles) are 103±8 km/s for 264.7 Å and 115±16 km/s for 274.2 Å. Fe XVI/Fe XXIII and He II lines in Figure 3(c-1) and (d-1) also show redshifted profiles. Although they are not fitted well with double Gaussian curves, they seem to have redshifted components of approximately 100 km/s.
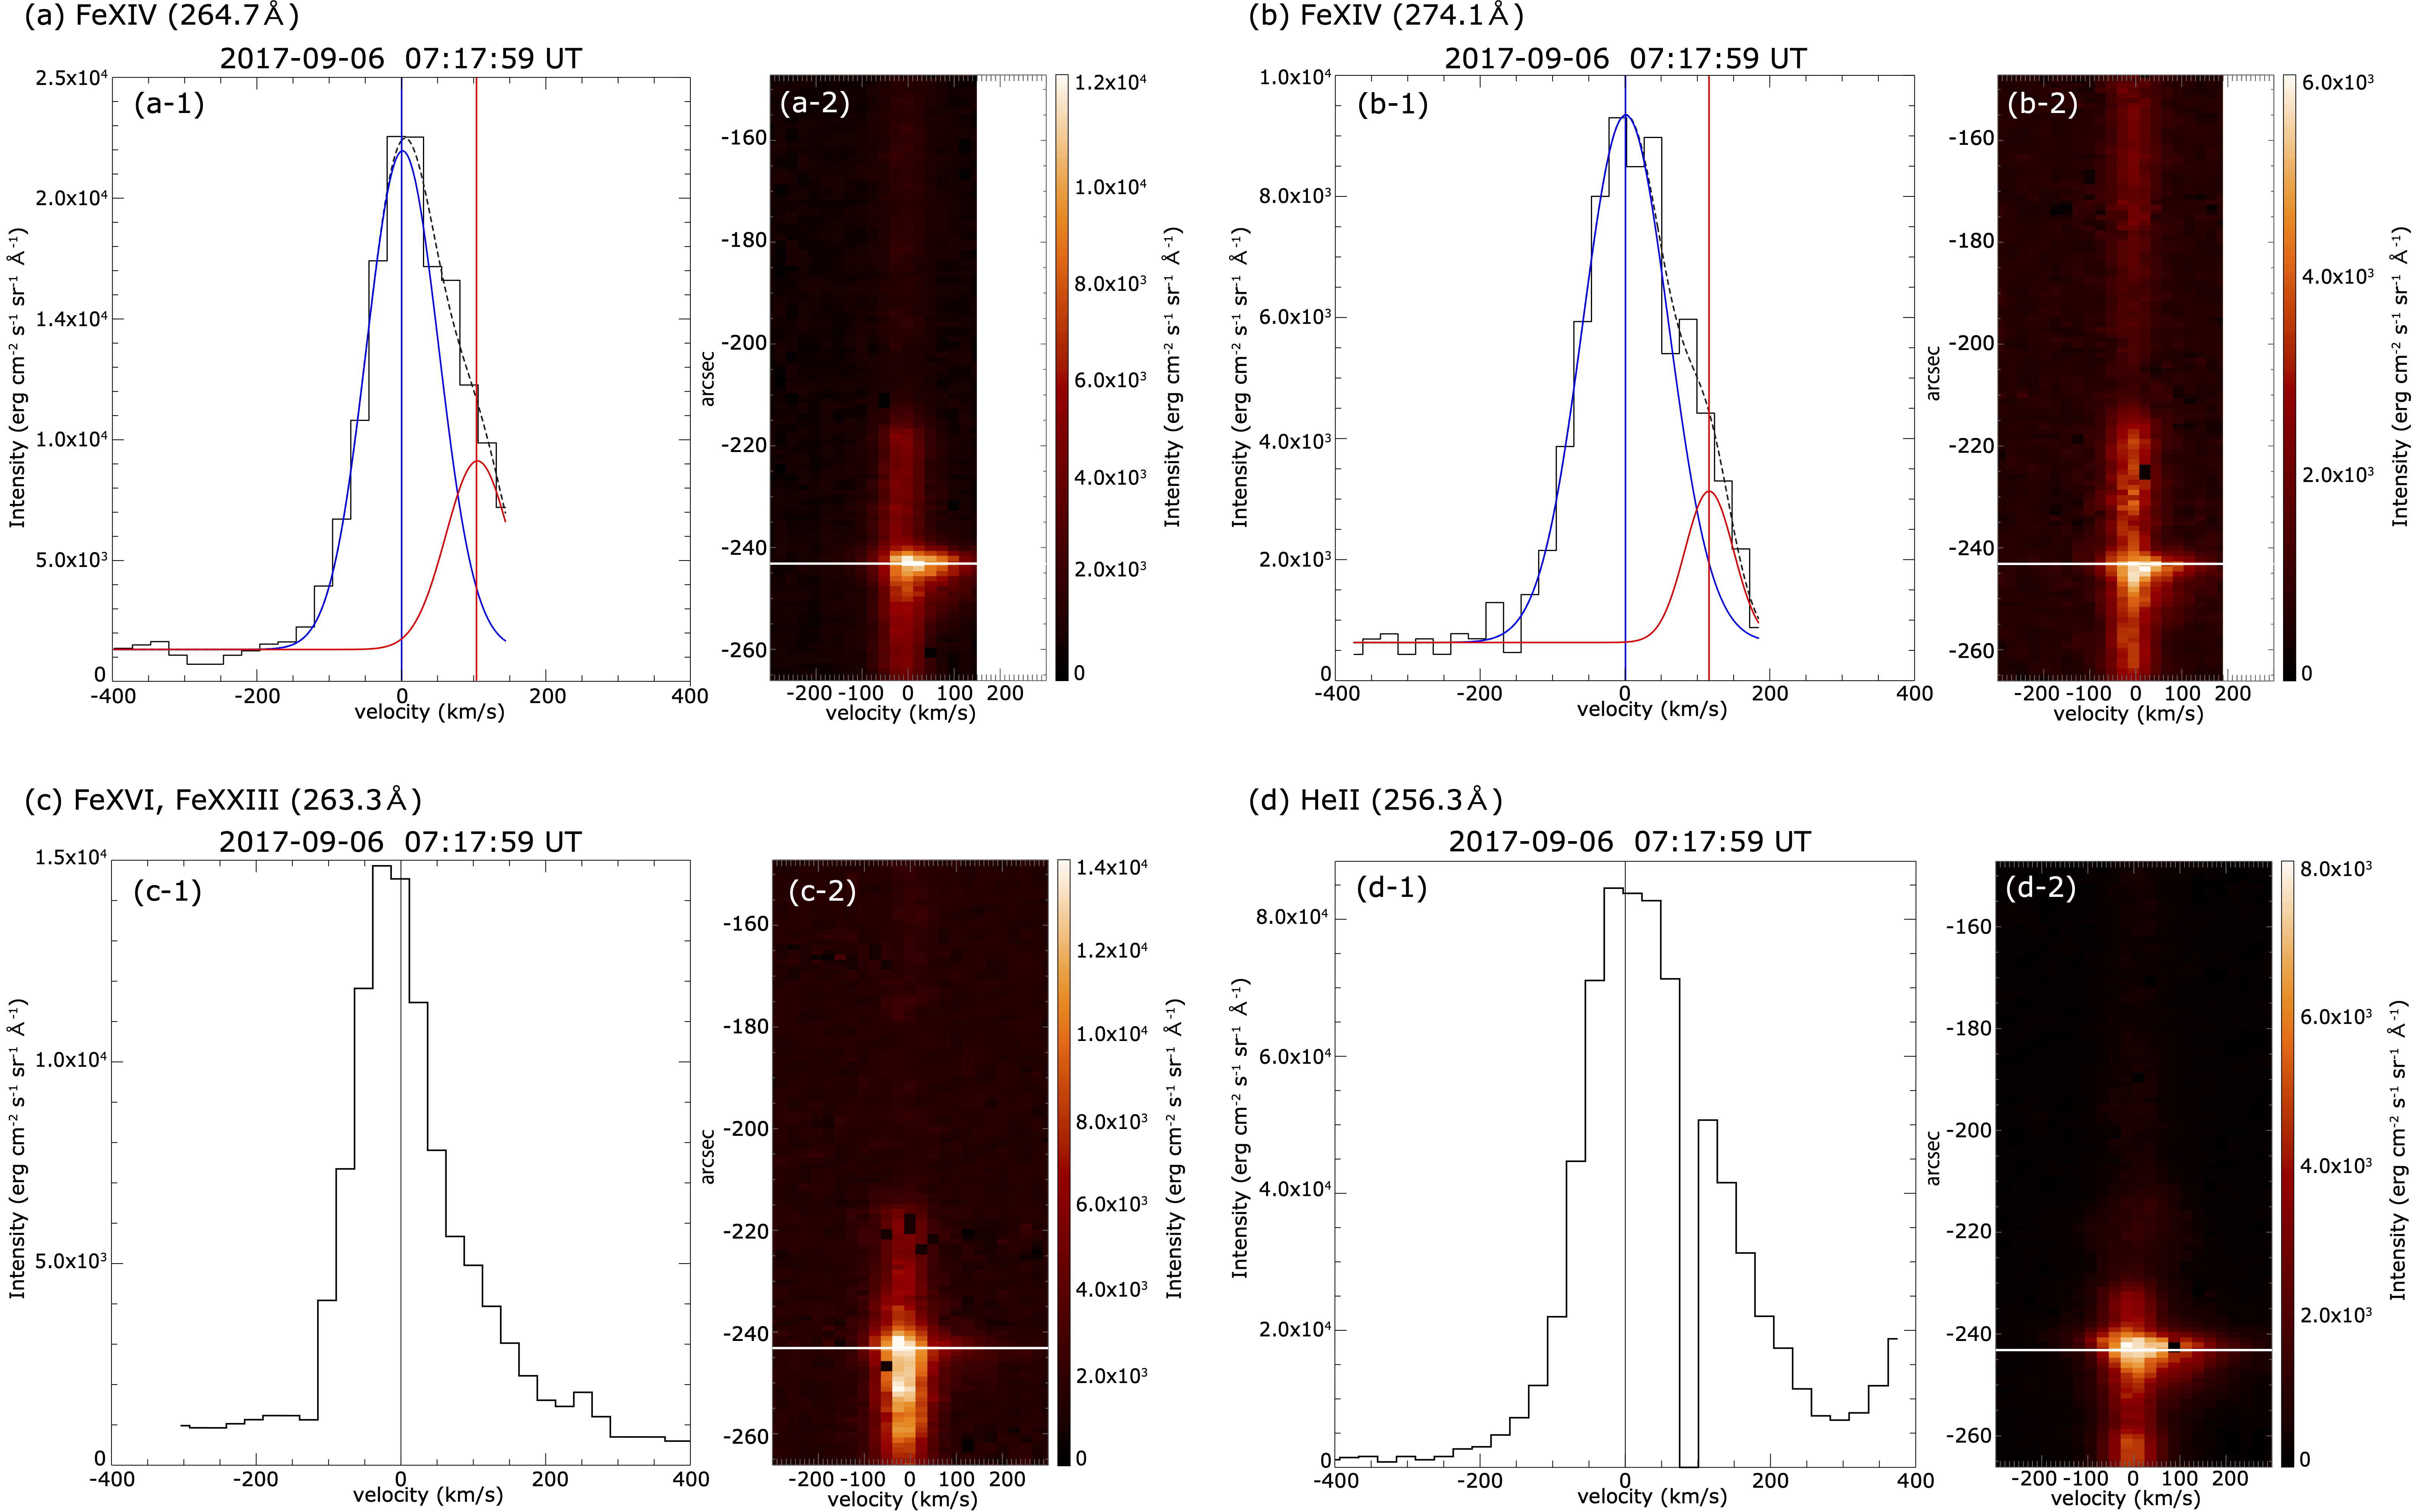
Figure 3: Spectral line profiles and spectral images around the redshifted region in Figure 2(c). The profile along the white horizontal line in each spectral image (right of each panel) are shown on the left. The vertical axes of the profiles represent intensity, and the vertical axes of the spectral images are along the slit. The horizontal axes represent the velocities resulting from single (in panels (c) and (d)) and double (in panels (a) and (b)) Gaussian fitting. The histogram with the black solid line depicts the intensity of each spectral line. The black broken lines are the result of Gaussian fitting, and the blue/red curves denote the first/second components obtained from double Gaussian fitting for the intensity profiles in panels (a-1) and (b-1).
Generally, Lorentz-force-driven flows such as reconnection outflows do not exhibit a clear temperature dependence, while pressure-gradient-driven flows such as chromospheric evaporation exhibit the strong temperature dependence (e.g., Fisher et al. 1985; Watanabe et al. 2010; Imada et al. 2015). We observed the downflow of approx. 100 km/s in both high-temperature Fe lines and low-temperature He II lines. The temperature is believed to increase with height in the atmospheres above the chromosphere (e.g., Vernazza et al. 1981) and, thus, each ion's characteristic temperature is suggested to correspond to the formation height of each emission line. Therefore, it is likely that the downflow illustrated in Figure 2(c) is driven by Lorentz force, and there is an energy input, such as magnetic reconnection, which occurs in the atmosphere higher than the formation height of the EIS Fe lines shown in Figure 3. The velocity of the downflow was approximately 100 km/s in all Fe and He lines in Figure 3, which is significantly lower than the Alfven velocity in the corona (order of 1000
km/s).
Bamba et al. (2017) found similar local, and transient upflow using IRIS lines, whose characteristic temperatures (log(T) approx. 4.0-4.8) are lower than those of the EIS lines used in the present study. In their case, a temperature-independent strong upflow with a velocity of up to 100 km/s was observed approximately 30 minutes before the onset of an X-class flare. Their upflow was very transient, but the corresponding brightening in the chromosphere continued until 10 minutes before the flare onset. Therefore, they suggested that the upflow is an indicator of precursor phenomena that represent the triggering of the X-class flare. In our case, it seems that the location of the cusp- shaped brightening and downflow corresponds to that of the push-mode magnetic reconnection, which plays a crucial role in triggering the X2.2 flare. However, it is unreasonable to assume that these features represent the direct trigger of the X2.2 flare because they were observed more than 1.5 hr before the flare onset and were not continue until the onset time of the X2.2 flare. Therefore, it is suggested that the cusp-shaped brightening and downflow are the indications of push-mode magnetic reconnection that gradually occurs at the tip of the intruding negative peninsula before the X2.2 flare.
For more details, see Y. Bamba, S. Inoue, and S. Imada, ApJ, 894:29, 2020:
Intrusion of Magnetic Peninsula toward the Neighboring Opposite-polarity Region That Triggers the Largest Solar Flare in Solar Cycle 24
References
Yamada, M. 1999, JGR, 104, 14529
van Ballegooijen, A. A., & Martens, P. C. H. 1989, ApJ, 343, 971
Green, L. M., Kliem, B., & Wallace, A. J. 2011, A&A, 526, A2
Fisher, G. H., Canfield, R. C., & McClymont, A. N. 1985, ApJ, 289, 425
Watanabe, T., Hara, H., Sterling, A. C., & Harra, L. K. 2010, ApJ, 719, 213
Imada, S., Murakami, I., & Watanabe, T. 2015, PhPl, 22, 101206
Vernazza, J. E., Avrett, E. H., & Loeser, R. 1981, ApJS, 45, 635
Bamba, Y., Lee, K.-S., Imada, S., & Kusano, K. 2017, ApJ, 840, 116
Next EIS Nugget »» coming soon...
TBC
Last Revised: 27-Oct-2011
Feedback and comments: webmaster
|


