Quantifying the Departures from Maxwellian: Active Region and Quiet Sun
Juraj Lörinčík, Jaro Dudík, Guilio del Zanna, Elena Dzifčáková, Helen Mason
Emission line intensities and their ratios allow for a wealth of diagnostics of optically thin plasma of the solar corona. Typically, ratios of line intensities can yield temperatures and electron densities, as well as elemental abundances. However, ratios of lines formed at widely different wavelengths are also sensitive to the presence of energetic particles. This arises as a consequence of different excitation thresholds for the two spectral lines, which sample different parts of the electron distribution.
To quantify the presence of energetic particles in the solar corona, we employed the non-Maxwellian kappa-distributions (e.g., Dudík; et al. 2017a). The parameter kappa primarily describes the high-energy tail, which is a power-law with the slope of kappa +1/2). For high kappa approaching infinity, the electron distribution reverts to a Maxwellian, while strong high-energy tails are present for low kappa values approaching the limit of 3/2. Kappa distributions of ions were previously detected from line profiles of both EIS flare (Jeffrey et al. 2016, 2017; Polito et al. 2018) and IRIS transition-region lines (Dudík et al. 2017b). Furthermore, they were seen in the flare electron flux spectra (Kašparová & Karlický 2009, Oka et al. 2013) that were also combined with AIA data (Battaglia et al. 2015). To detect the electron kappa-distributions from EIS line spectra, we had to first produce the synthetic spectra and evaluate which lines are best for diagnostics. Given that there is only one extra non-Maxwellian parameter, the synthesis of coronal spectra can be done analogously to the methods employed in the CHIANTI database, such as with the KAPPA package (see Dzifčáková et al. 2015 and Dudík et al. 2017a for details). We use the ionization equilibrium calculations from this package together with the latest atomic data for excitation provided by the UK APAP network (http://apap-network.org).
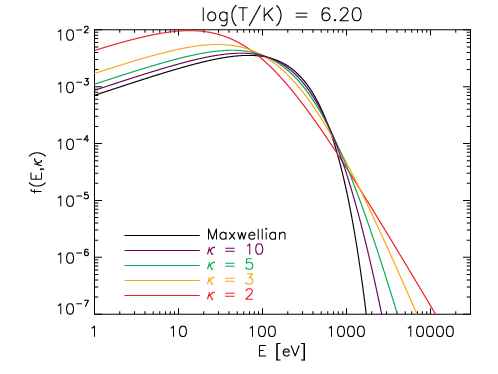
Figure 1: The kappa-distributions, shown for different values of kappa, as well as the asymptotic Maxwellian.
The EIS instrument observes emission lines in two channels, which can be utilized to detect the kappa-distributions. The Fe XI ion produces strong emission lines observed in the short-wavelength channel at 182.17 and 188.50 Å. In the long-wavelength channel, the relatively-weaker self-blended lines at 257.55 and 257.77 Å are observed. The 182.17 or 188.50 with respect to 257.55 or 257.77 Å ratios can be used for diagnostics of kappa (Dudík et al. 2015). However, these ratios are also strongly dependent on the electron density as well as electron temperature. Further complications can arise from the changes of the in-flight calibration of EIS with time (Del Zanna 2013, Warren et al. 2014).
In order to avoid any problems associated with the degradation of the EIS sensitivity and differences in calibration, we selected full EIS datasets (that contain all observable lines) obtained shortly after the start of the mission. The off-limb quiet Sun observations were performed on 2007 March 11 using 90 s exposures, while the active region chosen was rastered with 30 s exposures on 2007 February 5 (Figure 2). We adopted the ground calibration and selected several regions for detailed analysis: three regions of quiet Sun, QS1-3, two active region loops LC and LS, and two moss regions M1 and M2. Background subtraction was performed in the active region observations. The background emission could not be removed in the quiet Sun, which contains only diffuse plasma emission. The line intensities in the selected regions were averaged to increase the signal-to-noise ratio, especially in the weaker Fe XI 257.55 and 257.77 Å lines.
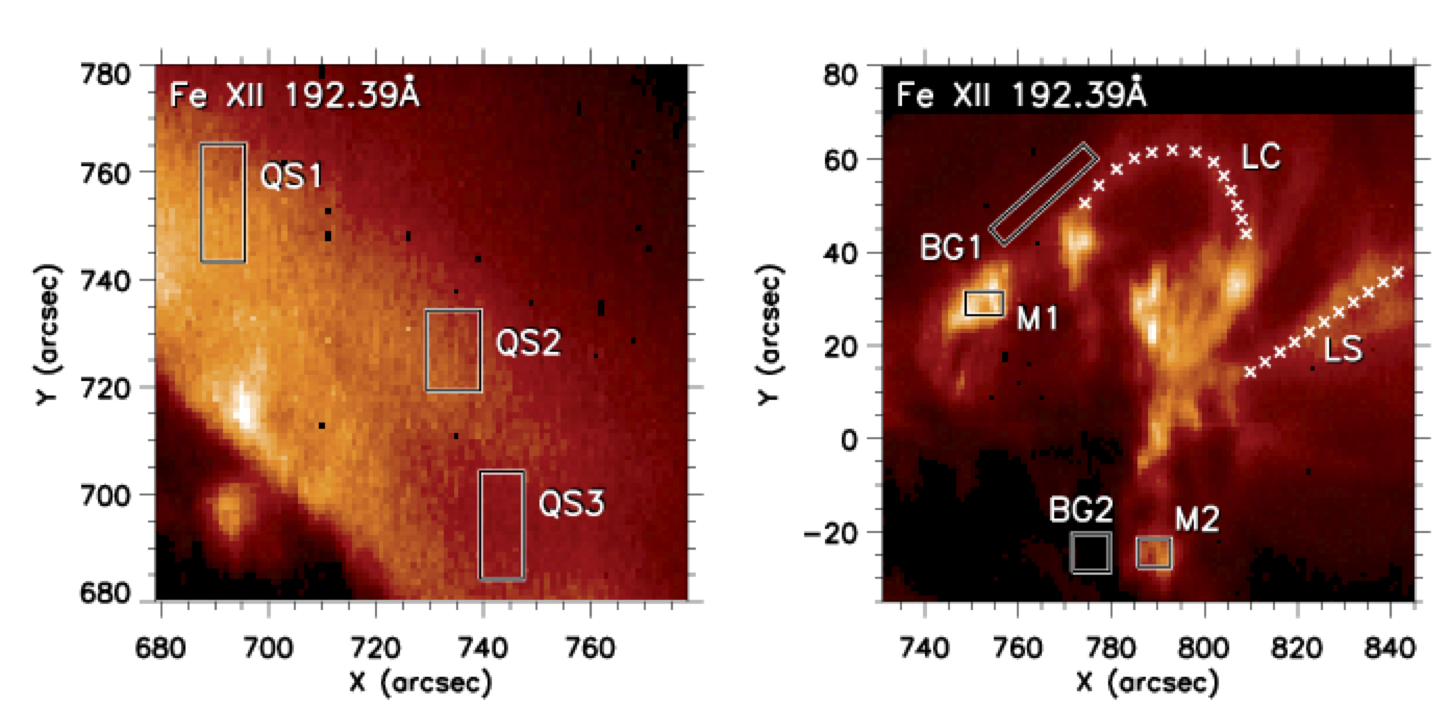
Figure 2: EIS observations of the quiet Sun (left) and an active region (right). Areas selected for further analysis are marked by boxes, or, in the case of loops LC and LS, by symbols 'x'. Background areas BG1 and BG2 are also shown in the active region observation.
We note that in both the quiet Sun and active regions, the observed ratio of the Fe XI 182.17 / 257.55 Å is about 2.5, while the Fe XI 182.17 / 257.77 Å is about 6. This is peculiar, given that active region structures are about an order of magnitude denser than the quiet Sun, meaning that the ratios should be different in active regions compared to the quiet Sun.
To find an answer to this apparent inconsistency, we have to diagnose several parameters simultaneously: Electron density, (electron) temperature or DEM if plasma is multithermal; and finally kappa - the departures from Maxwellian. This task is made easier by the two factors: (i) density-sensitive line ratios are only weakly dependent on temperature and kappa and (ii) the DEM is nearly independent on electron density (but depends on kappa). We diagnose the plasma parameters using an iterative scheme, where we first (1) obtain the possible range of electron densities, considering all possible temperatures and kappa, then (2) construct DEMs as a function of kappa, (3) use the DEMs obtained to narrow down the spread of the density-sensitive ratios and get the actual electron densities; which we then finally use to (4) diagnose the kappa.
We find that the active region loops have densities of about log(Ne/cm^-3) = 9 and are slightly multithermal, with DEMs peaking at log(T/K) = 6.2-6.4, while the QS regions are nearly isothermal and much less dense, with densities of about log(Ne/cm^-3) = 8.2 (for details, see Lörinčík et al. 2020). We also find that the quiet Sun is Maxwellian (within photon noise uncertainty, see Figure 3 left), while the active region loops are strongly non-Maxwellian, with kappa of about 2 (Figure 3 right). These findings are made possible by the use of ratio-ratio diagrams, where one ratio is plotted as a dependence on the other ratio. By doing so, one can separate the two parameters of any electron energy distribution, that is, temperature and kappa. On one axis, a ratio dominantly sensitive to kappa is used - in our case, Fe XI 182.17 / 257.55 or 257.77 Å. The other axis contains a ratio dominantly sensitive to temperature Å such as the Fe XII 192.37 Å / Fe XI 182.17 Å. These results are also valid for multithermal plasmas, where the ratio-ratio curves are folded over the respective DEMs as a function of kappa (see colored asterisks in Figure 3).
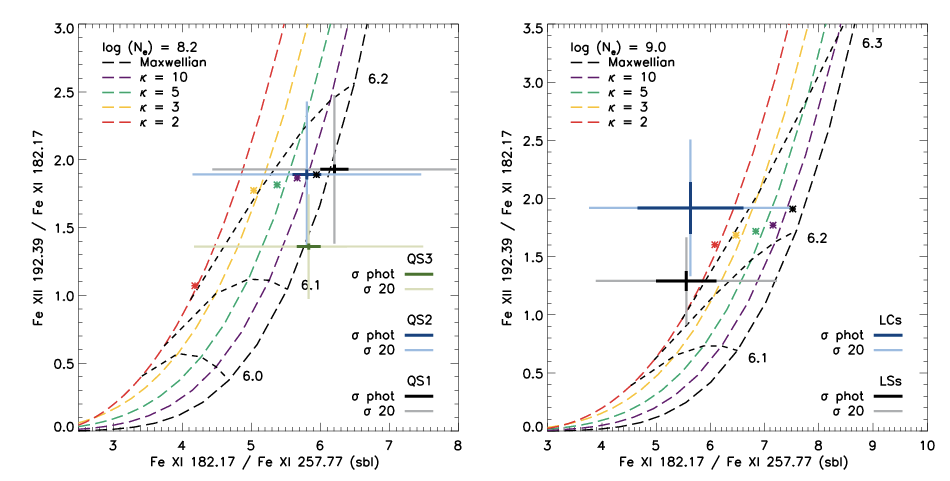
Figure 3: Diagnostics of kappa using the Fe XI lines in the quiet Sun (left) and active region loops (right). The observed line ratios are shown by crosses, with the thick crosses denoting the photon noise uncertainty. Theoretical line ratios are shown by dashed lines - black for Maxwellian, and colors for different values of kappa. The theoretical ratios are calculated for the densities diagnosed in the respective structures: log(Ne/cm^-3) = 8.2 in the quiet Sun and 9.0 in the background-subtracted active region loops LCs and LSs. DEM-folded theoretical line intensities are shown by colored asterisks.
In conclusion, the presence of non-Maxwellian kappa-distributions in active region loops can explain the peculiar Fe XI line intensity ratios observed in the active regions, which are the same as in the quiet Sun. Furthermore, the finding that the quiet Sun is Maxwellian is an important verification that both the atomic data and the calibration of EIS are correct.
The link to the paper is here:
Plasma
Diagnostics from Active Region and Quiet Sun Spectra Observed by
Hinode/EIS: Quantifying the Departures from a Maxwellian Distribution
References
Lörinčík, J., Dudík, J., Del Zanna, G., Dzifčáková, E., Mason, H. E.: 2020, ApJ 893, 34
Battaglia, M., Motorina, G., Kontar, E. 2015, ApJ 815, 73
Del Zanna, G. 2013, A&A 555, A47
Del Zanna, G., Gupta, G. R., Mason, H. E. 2019, A&A 631, A163
Dudík, J., Dzifčáková, E., et al. 2017a, SoPh 292, 100
Dudík, J., Polito, V., Dzifčáková, E., Del Zanna, G., & Testa, P. 2017b, ApJ 842, 19
Dudík, J., et al., 2015, ApJ 807, 123
Dzifčáková, E., et al. 2015, ApJS 217, 14
Jeffrey, N. L. S., Fletcher, L., & Labrosse, N. 2016, A&A 590, A99
Jeffrey, N. L. S., Fletcher, L., & Labrosse, N. 2017, ApJ 836, 35
Kašparová, J. & Karlický, M. 2009, A&A 497, L13
Oka, M., Ishikawa, S., Saint-Hilaire, P., Krucker, S., & Lin, R. P. 2013, ApJ 764, 6
Polito, V., Dudík, J., Kašparová, J., et al. 2018, ApJ 864, 63
Warren, H. P., Ugarte-Urra, I., & Landi, E. 2014, ApJS 213, 11
Next EIS Nugget »» coming soon...
TBC
Last Revised: 27-Oct-2011
Feedback and comments: webmaster
|


