A Solar Magnetic-fan Flaring Arch Heated by Nonthermal Particles and Hot Plasma from an X-Ray Jet Eruption
Kyoung-Sun Lee, Hirohisa Hara, Kyoko Watanabe, Anand D. Joshi, David H. Brooks, Shinsuke Imada, Avijeet Prasad, Phillip Dang, Toshifumi Shimizu, Sabrina L. Savage, Ronald Moore, Navdeep K. Panesar, and Jeffrey W. Reep
The standard solar flare model (CSHKP; Carmichael 1964; Sturrock 1968; Hirayama 1974; Kopp & Pneuman 1976) proposes that magnetic reconnection occurs at coronal heights and the subsequently released magnetic energy is transported to the lower atmospheric layers. Then, the heated plasma from the dense lower atmosphere fills in the flare loop which is observed as the soft X-ray (SXR) intensity enhancement. Also, the hard X-ray (HXR) imagers showed the non-thermal emission as indirect evidence of magnetic reconnection and particle acceleration near the loop-top or flare loop footpoint. Therefore, the hot loop-top sources (a cusp or candle flame morphology) and associated overlying structures are suggested the reconnection region related to the flare and also important for understanding the energy release process during a standard flare.
On the other hand, flares produced by low atmospheric reconnection have been reported with the observations of X-ray, EUV jets, and H¦Á surges (Hanaoka 1997; Ohyama et al. 1997; Shibata 1998; Moore & Sterling 2007; Bain & Fletcher 2009; Zhang & Ji 2014; Panesar et al. 2016). Some flares were ejective due to secondary reconnection between the blowout jet eruption and overlying coronal field (Moore & Sterling 2007; Sterling et al. 2017). Others were confined by the strong overlying fields and observed as the X-ray flaring arches/loops with H-alpha surges or strong footpoint brightenings (Tang & Moore 1982; Martin & Svestka 1988; Svestka et al. 1989). Those confined flaring arches are also associated with remote brightenings at the other footpoint, energized by the accelerated electrons and X-ray plasma traversing along the arch.
In Lee et al. (2020), we have investigated an M1.3 limb flare exhibiting both characteristics of the standard flare (hot apparent cusp) and confined flare (flaring arch footpoint brightening but lacking CME), which was also reported by Hernandez-Perez et al. (2019). Figure 1 displays the M1.3 flare (hot flare cusp, the cool jet, and flaring arch footpoint brightenings) in SDO/AIA different wavelength channel images. We have comprehensively studied this flare using multiwavelength imaging, spectroscopic and stereoscopic analysis, and magnetic field extrapolation. In particular, we estimate the height variation of the plasma properties quantitatively using Hinode/EIS observation (EIS study: FlareResponse01) for the flare by taking advantage of the limb observation. Then, we explore how the hot flare loop plasma is energized by higher coronal reconnection (standard flare) or lower atmospheric reconnection.

Figure 1: Context SDO/AIA images for the M1.3 flare on 2014 January 13 in different channels. Intensity scale is reversed in panels (a), (b), (d), and (e). Panels (c) and (f) show running difference images. The red boxes correspond to the locations for the light curves in different wavelengths (temporal evolution) and the density and temperature measurements along the flare loop height.
Figure 2 shows the EIS intensity image and spectral line profiles of Ca XVII 192.85 Å window (including Fe XXIV 192.03 Å (log T ∼ 7.2) spectral line) along the flare loop structure (region A-E) at the impulsive phase of the flare. The spectral line profiles of Fe XXIV emission along the height shows that there are strong redshifts (∼300-500 km s^(-1)) along the loop-top region (locations (D) and (E) in Figure 2). Combining with the constructed 3D loop configuration from the STEREO/EUVI-A and SDO/AIA observations (ref. Figures 15 and 16 in Lee et al. 2020), we find that the strong redshift in the loop-top region is due to upflowing plasma originating from the jet.
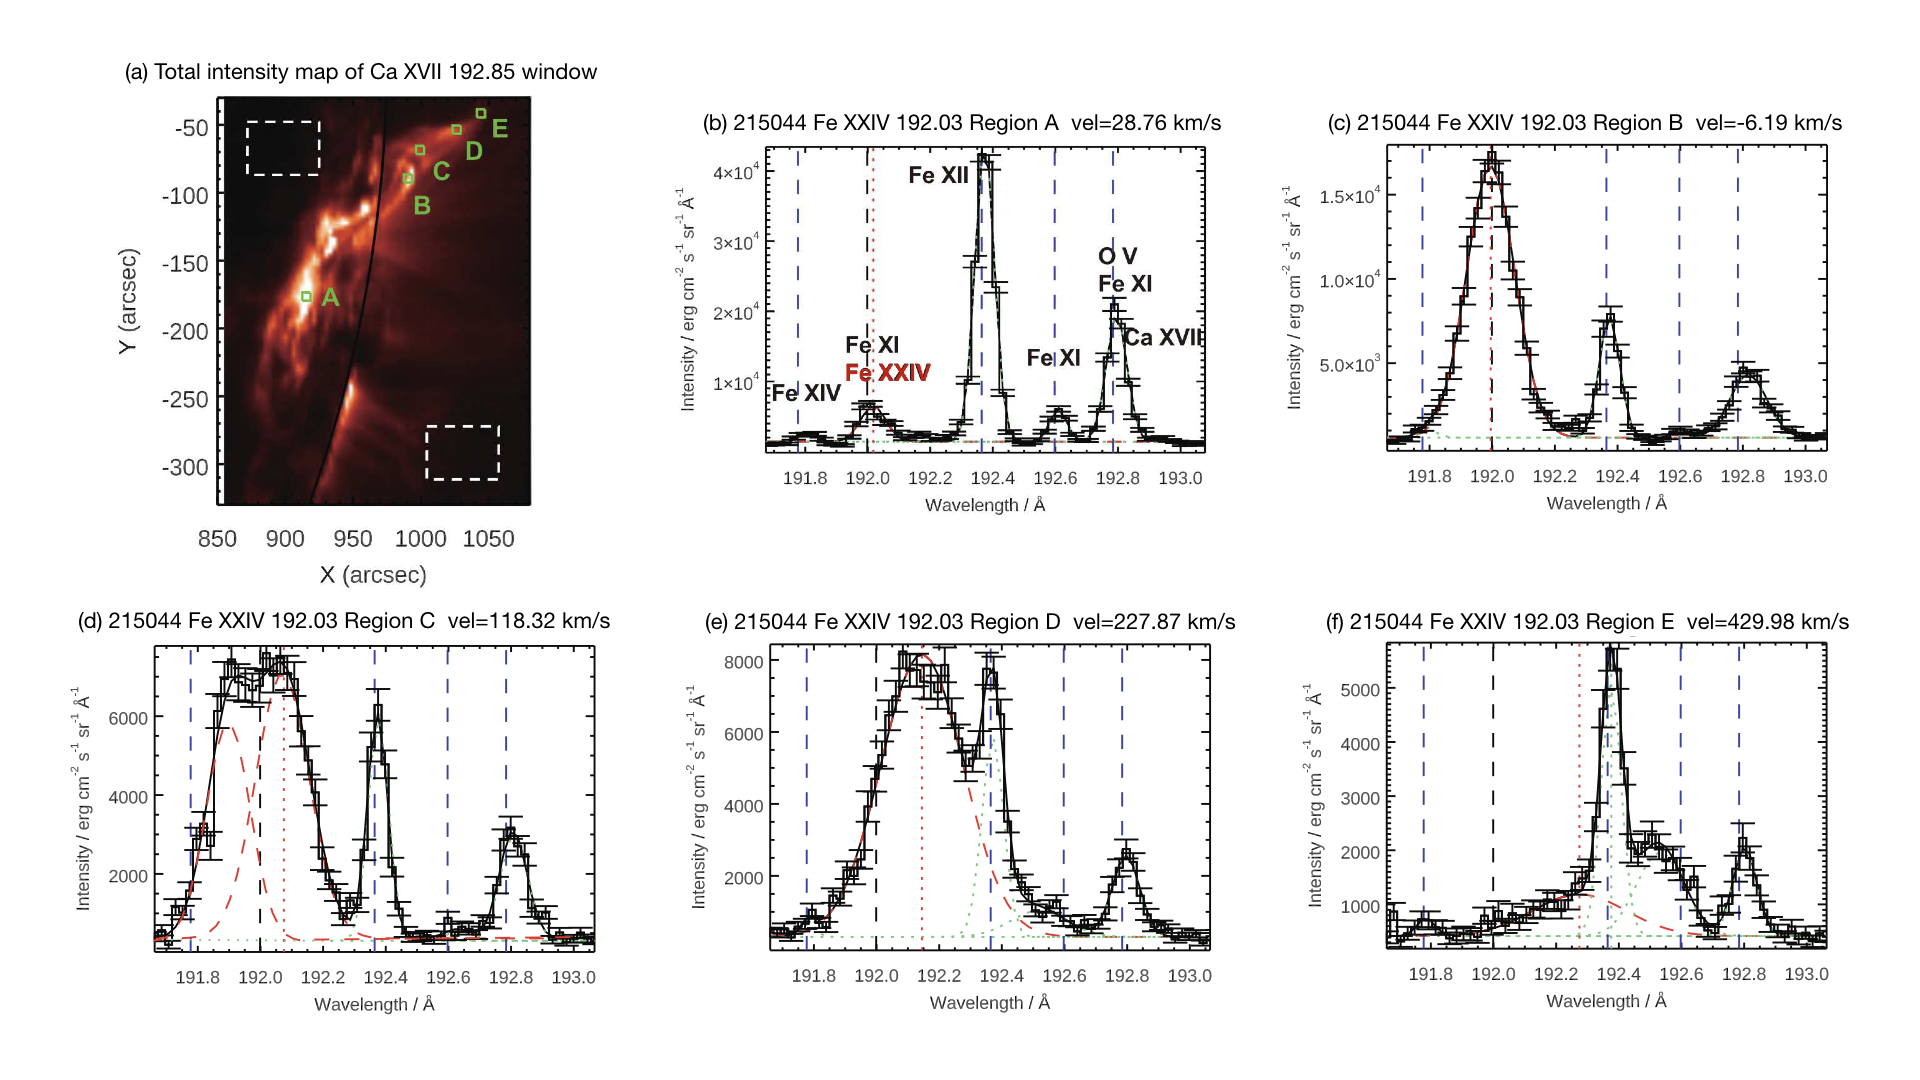
Figure 2: EIS intensity image and spectral line profiles for the flare loop locations (A-E) from the EIS Ca XVII 192.85 Å window at 21:50:44 UT (impulsive phase). Panel (a): total intensity image of the EIS Ca XVII 192.85 Å window. The white dashed boxes correspond to the quieter regions used for measuring reference wavelengths. The green boxes indicate the locations corresponding to the spectral line profiles. Panel (b) - (f): the spectral line profiles in the EIS Ca XVII 192.85 Å window. The red dashed (Fe XXIV) and green dotted (Fe XIV, Fe XII, Fe XI, and Ca XVII) lines represent the fitted components of the multiple-Gaussian fitting analysis, respectively. The solid lines represent the fitted total line spectral profile. The black dashed and red dotted vertical lines correspond to the reference wavelength of Fe XXIV and center wavelength of the fitted component of Fe XXIV, respectively. The measured Doppler velocity of the Fe XXIV is written in each panel.
We also estimated the electron temperature and density measurements along the flare loop height using the ratio of EIS Fe XXIV 255.10 to Fe XXIII 263.76 Å and Fe XII 186.88 to 192.37 Å, respectively. We found that the temperature increases with height to a value of over 10^7 K at the loop top during the flare, and the density measurements along the flaring loop decreases with height and varies in the range of log Ne = 8.3 - 10.2. The temporal variation of the density in the loop-top shows that the density increases from 0.3 X 10^9 cm^(-3) early in the flare rise to 1.3 X 10^9 cm^(-3) after the flare peak. The density enhancement measured from the Fe XII spectra in the later phase implies that the hot plasma density at the loop top is later observed in Fe XII after the hot plasma cools down.
To understand the heating and cooling process of the flare, we compare the observed cooling time with the theoretical models of loop cooling timescale. Based on the temperature and density measurement at the flare loop-top from the EIS observations, we calculate the conductive and radiative cooling timescales for the loop (Cargill et al. 1995; Bradshaw & Cargill 2010) and make a fit of the temporal evolution of the temperature using the conductive cooling model for static and evaporative cooling. Figure 3 presents those fits (dashed: static cooling, solid: evaporative cooling) overlaid with the observed temporal evolution of the temperature in the flare plasma which is measured from the GOES, XRT, and AIA light curves. The peak temperature of each channel is determined from its dominant spectral lines (O'Dwyer et al. 2010, 2014). We also plot the temperature range using the half width of the peak temperature response function as an error bar. The observed temperature evolution of the flare arch is consistent with the conductive cooling curve for the evaporation case. This result implies that there was insignificant additional heating of the flaring fan loop after the impulsive energy input from the jet. Then, this flaring loop cooled down by conduction with evaporation.
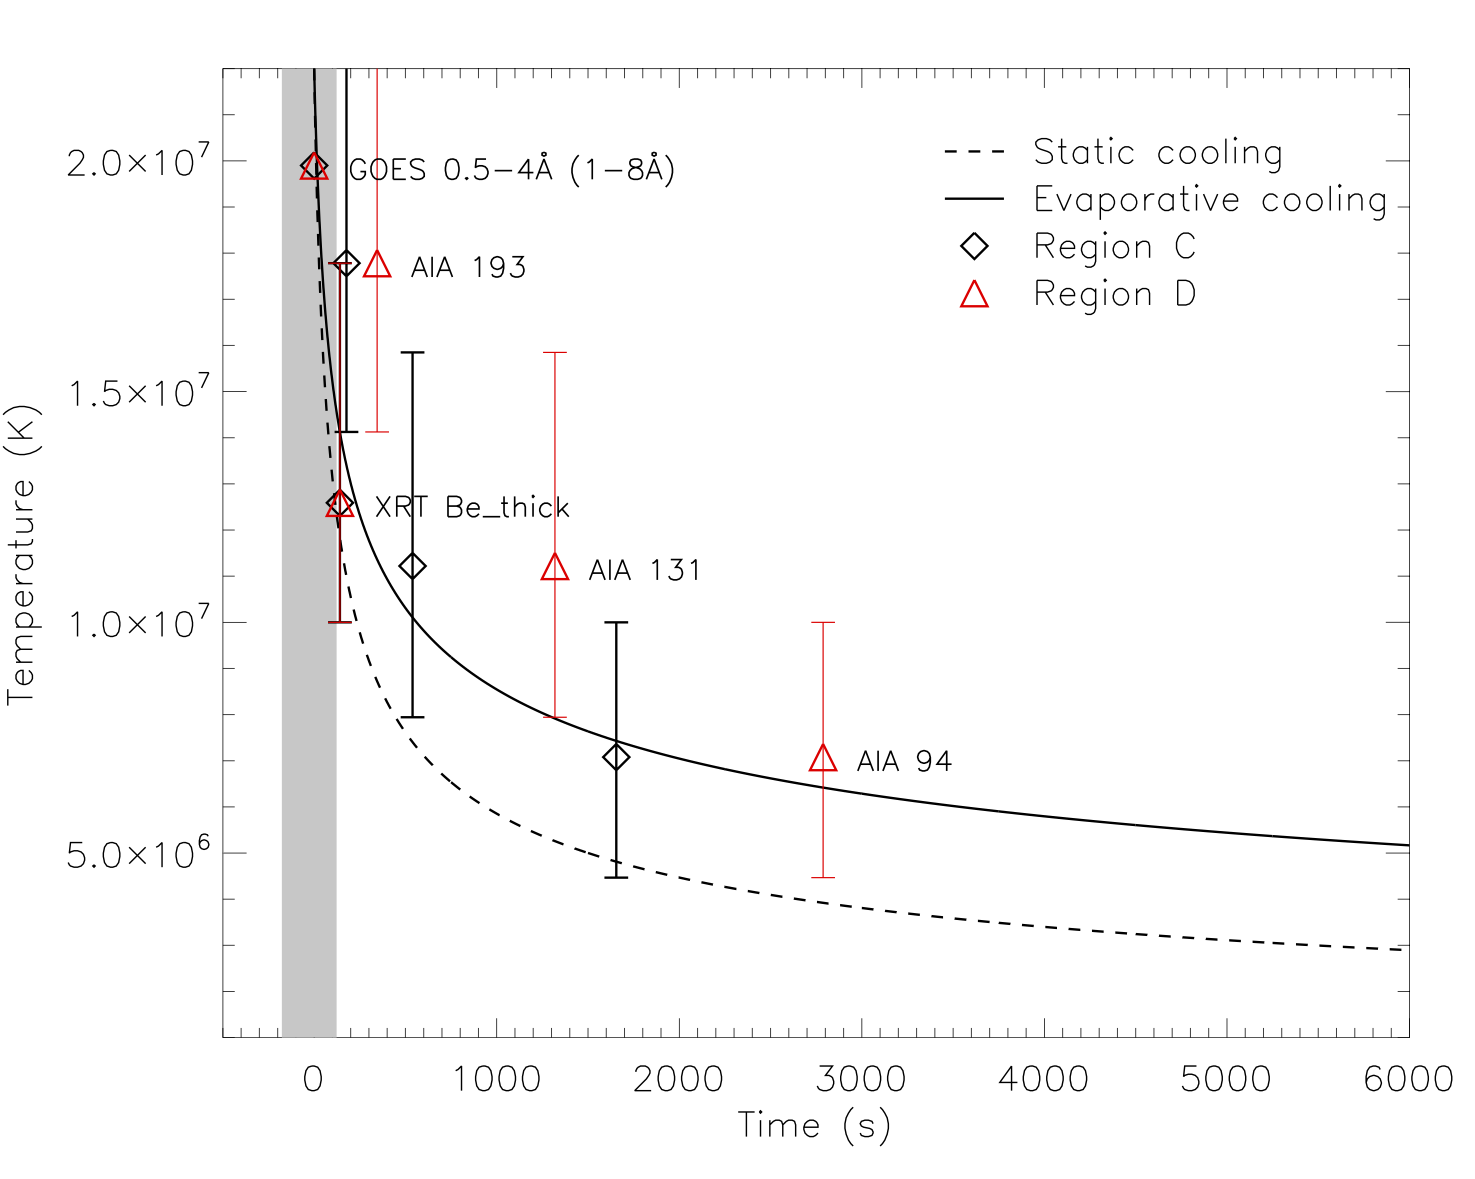
Figure 3: Temporal evolution of temperature estimated from the theoretical conductive cooling models. The dashed and solid lines correspond to the static and evaporative cooling cases, respectively. The diamond and triangle symbols are the observed peak time delays from the different instrument and wavelength channels using their peak response temperatures for regions (C) and (D) in Figure 2. The error bars indicate the half width of the temperature peak of the response functions for each channel. The gray area indicates the jet flare duration from the GOES flare list.
In addition, a comprehensive set of observed features consists of the following: (1) a primary footpoint brightening with HXR emission, (2) a lack of HXR emission at the loop top, (3) enhancement of the loop-top SXR emission after the footpoint brightening, (4) a short duration of the event in the GOES SXR light curve, and (5) magnetic topology characterized by an overlying magnetic fan loop system (shown in Figure 4). Comparing these results with flare loop plasma cooling models, we confirm that this flare is an example of the flaring arch. Figure 5 is our schematic cartoon of the magnetic-fan flare arch model for this flare. The flare was energized by external reconnection associated with the jet eruption at the base of the magnetic fan (panel a). The hot plasma in the flare arches is confined in the body of the magnetic-fan arch structure, and the accelerated electrons and hot X-ray emission propagate through the arch from its explosive foot (panel b). The arch system is observed as a hot, cusp shaped loop due to the projection on the limb. We conclude that the arch is mostly heated via low atmospheric reconnection, which is in contrast to the standard flare model energized by higher coronal reconnection.

Figure 4: Result of the magnetic field extrapolation using an SDO/HMI vector magnetogram from three days before the flare. Panel (a): region of the HMI vector magnetogram used for the magnetic extrapolation. The red box centers on the isolated region of positive polarity. Panel (b): SDO/AIA 1600 Å image shows the sunspot location and flare brightening at the two ends of the flaring arch. Panel (c): extrapolated magnetic fields. The red lines indicate the overlying fields while the yellow lines correspond to the inner reconnecting fields. Panel (d): Q map showing the squashing factor values. The red boxes in panels (c) and (d) mark the jet location.
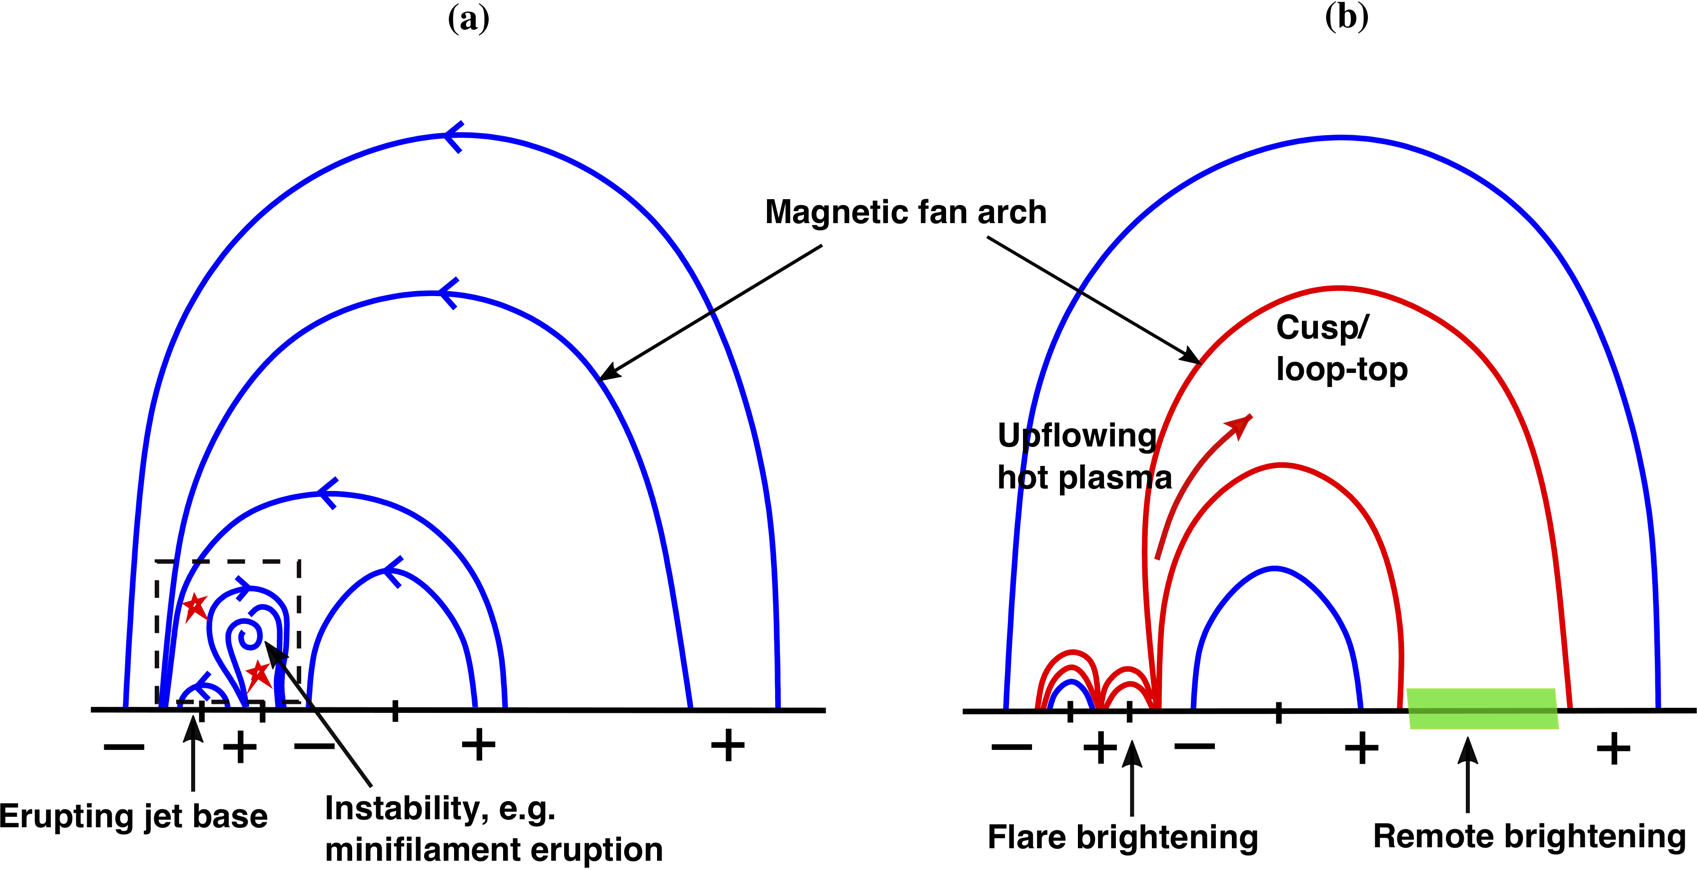
Figure 5: Schematic cartoon of the blowout jet and the magnetic-fan flare arch model for this flare. The star symbols mark the magnetic reconnection sites. Panel (a) depicts the topology and reconnection of the magnetic field in the eruption that generates the jet and heats the magnetic-fan flaring arch by driving external reconnection of the erupting field with the field in the leg of the fan. Panel (b) depicts how the external reconnection expels accelerated electrons and heated plasma (red arrow) along the reconnected field of the magnetic-fan arch (red field lines). The green colored area corresponds to the remote brightening (the flare ribbon in AIA 1600 Å channel) at the other foot of the flaring loop/arch.
For more details, see Lee et al, ApJ, 895:1, 2020:
A Solar Magnetic-fan Flaring Arch Heated by Nonthermal Particles and Hot Plasma from an X-Ray Jet Eruption
References
Carmichael H. 1964, NASA Special Publication, 50, 451
Sturrock, P.A. 1966, Nature, 211
Hirayama, T. 1974, Solar Physics, 34, 323Kopp & Pneuman 1976
Kopp, R.A., & Pneuman, G.W. 1976, Solar Physics, 50, 85
Hanaoka, Y. 1997, Solar Physics, 173, 319
Ohyama, M., Shibata, K., Yokoyama, T., & Shimojo, M. 1997, Advances in Space Research, 19, 1849
Shibata, K. 1998, Astrophysics and Space Science, 264, 129
Moore, R. L., & Sterling, A. C. 2007, The Astrophysical Journal, 661, 543
Bain, H. M., & Fletcher, L. 2009, Astronomy & Astrophysics, 508, 1443
Zhang, Q. M., & Ji, H. S. 2014, Astronomy & Astrophysics, 561, A134
Panesar, N. K., Sterling, A. C., & Moore, R. L. 2016, The Astrophysical Journal Letters, 822, L23
Sterling, A. C., Moore, R. L., Falconer, D. A., Panesar, N. K., & Martinez, F. 2017, The Astrophysical Journal, 844, 28
Tang, F., & Moore, R. L. 1982, Solar Physics, 77, 263
Martin, S. F., & Svestka, Z. F. 1988, Solar Physics, 116, 91
Svestka, Z., Farnik, F., Fontenla, J. M., & Martin, S. F. 1989, Solar Physics, 123, 317
Lee, K.-S., Hara, H., Watanabe, K., et al. 2020, The Astrophysical Journal, 895, 42
Hernandez-Perez, A., Su, Y., Thalmann, J., et al. 2019, The Astrophysical Journal Letters, 887, L28
Cargill, P. J., Mariska, J. T., & Antiochos, S. K. 1995, The Astrophysical Journal, 439, 1034
Bradshaw, S. J., & Cargill, P. J. 2010, The Astrophysical Journal, 717, 163
O'Dwyer, B., Del Zanna, G., Mason, H. E., Weber, M. A., & Tripathi, D. 2010, Astronomy & Astrophysics, 521, A21
O'Dwyer, B., Del Zanna, G., & Mason, H. E. 2014, Astronomy & Astrophysics, 561, A20
Next EIS Nugget »» coming soon...
TBC
Last Revised: 27-Oct-2011
Feedback and comments: webmaster
|


