Location of non-thermal velocity in the early phases of a large flare - revealing the pre-eruption flux rope?
Louise Harra, Sarah Matthews, J.L. Culhane, Mark Cheung, E. Kontar and Hiro Hara

Non-thermal velocity measurements of the solar atmosphere, particularly from UV and X-ray emission lines have demonstrated over the decades that this parameter is important in understanding the triggering of solar flares. The non-thermal velocity is simply a measure of how much the spectral line width s enhanced above the thermal width. Enhancements have often been observed before the flare intensity enhancements are seen and are hence are a good parameter to understand the important early phases of flares. However, until the launch of Hinode, it has been difficult to determine the spatial location of the enhancements to better understand the source region. The Hinode EUV Imaging Spectrometer (EIS) has the spectral and spatial resolution to allow us to probe the early stages of flares in detail. (See Harra et al. 2013, ApJ, 774, 122 at: http://iopscience.iop.org/0004-637X/774/2/122/).
We analyse four events, all of which are GOES M or X-classification flares, and all are located towards the limb for ease of flare geometry interpretation. Three of the flares were eruptive and one was confined. Figure 1 shows an example of one of the eruptive flares.
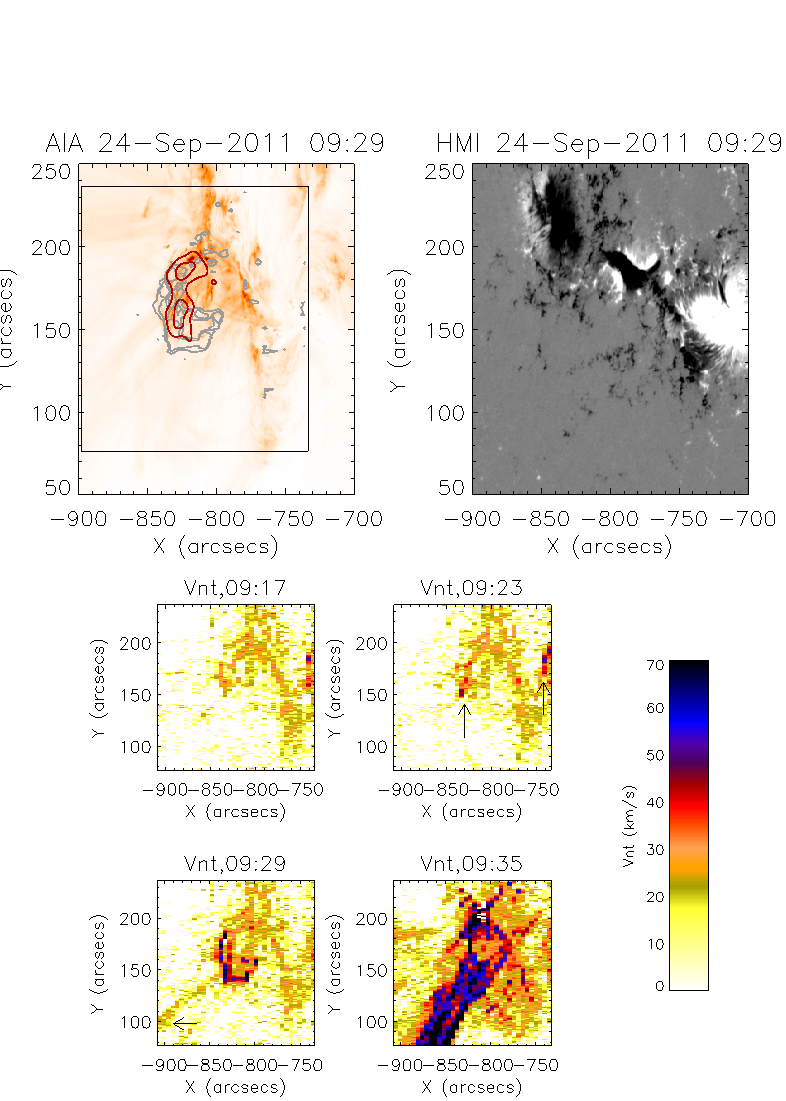
Figure 1: Example of one of the eruptive flares. The top image shows the AIA image with RHESSI contours (red) and non-thermal velocity contours (grey). The image sequence below shows the non-thermal velocity before the flare starts, at the time the flare starts and as the eruption begins.
The temporal evolution of the non-thermal velocity in different locations shows quite different behaviour. Figure 2 demonstrates the intensity and non-thermal velocity enhancements at three separate locations. Region A shows both intensity and non-thermal velocity increases and is at the flare site itself. Region B is just outside the flaring active region and shows no intensity enhancement – but there is a non-thermal velocity enhancement – and indeed this region shows fluctuations around the times of the other eruptive flares from this region. Region C is above the flare loops and clearly shows the region of dynamic plasma as the eruption occurs – again this is not clearly seen in intensity.
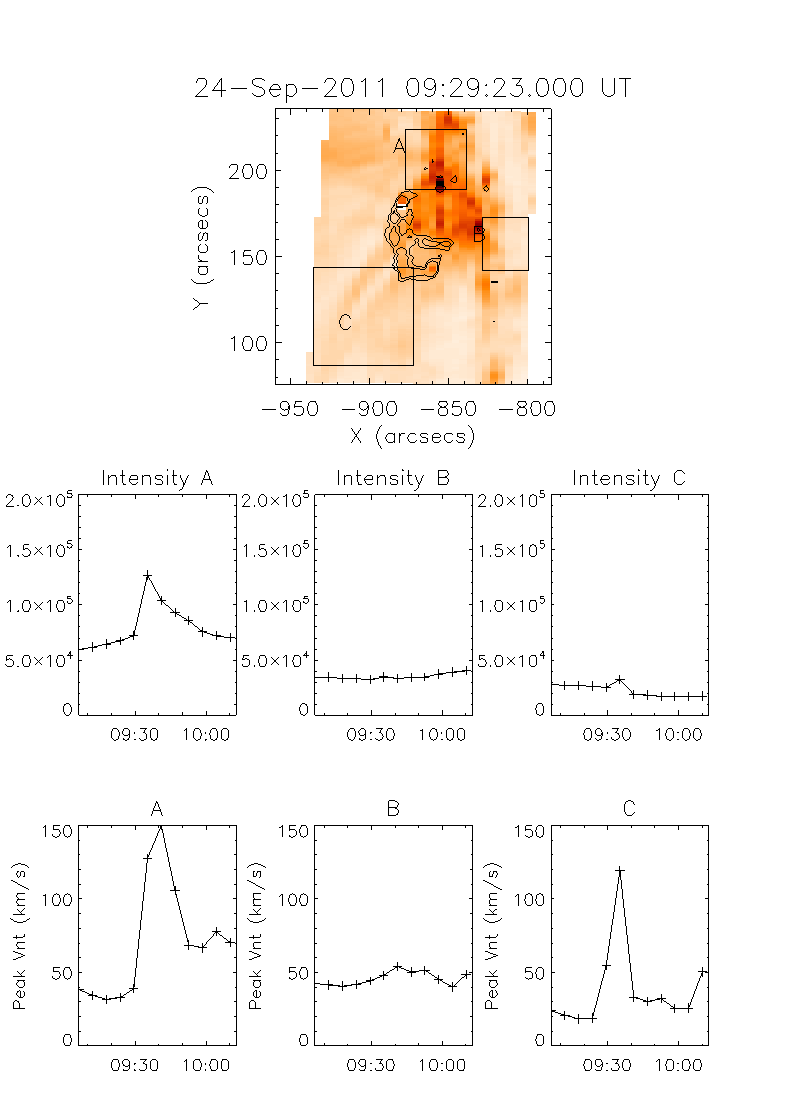
Figure 2: The top image shows 3 different regions where we analyse the temporal evolution of the intensity and non-thermal velocity.
Region B is of particular interest, and we explored what may be causing this region that doesn’t seem intimately involved in the event to show fluctuations. Looking at the dimming images it appears that the region of enhanced non-thermal velocity before the event are where the dimming region subsequently appears, indicating a destabilization of the structure. This is suggestive of a coronal flux rope being activiated.
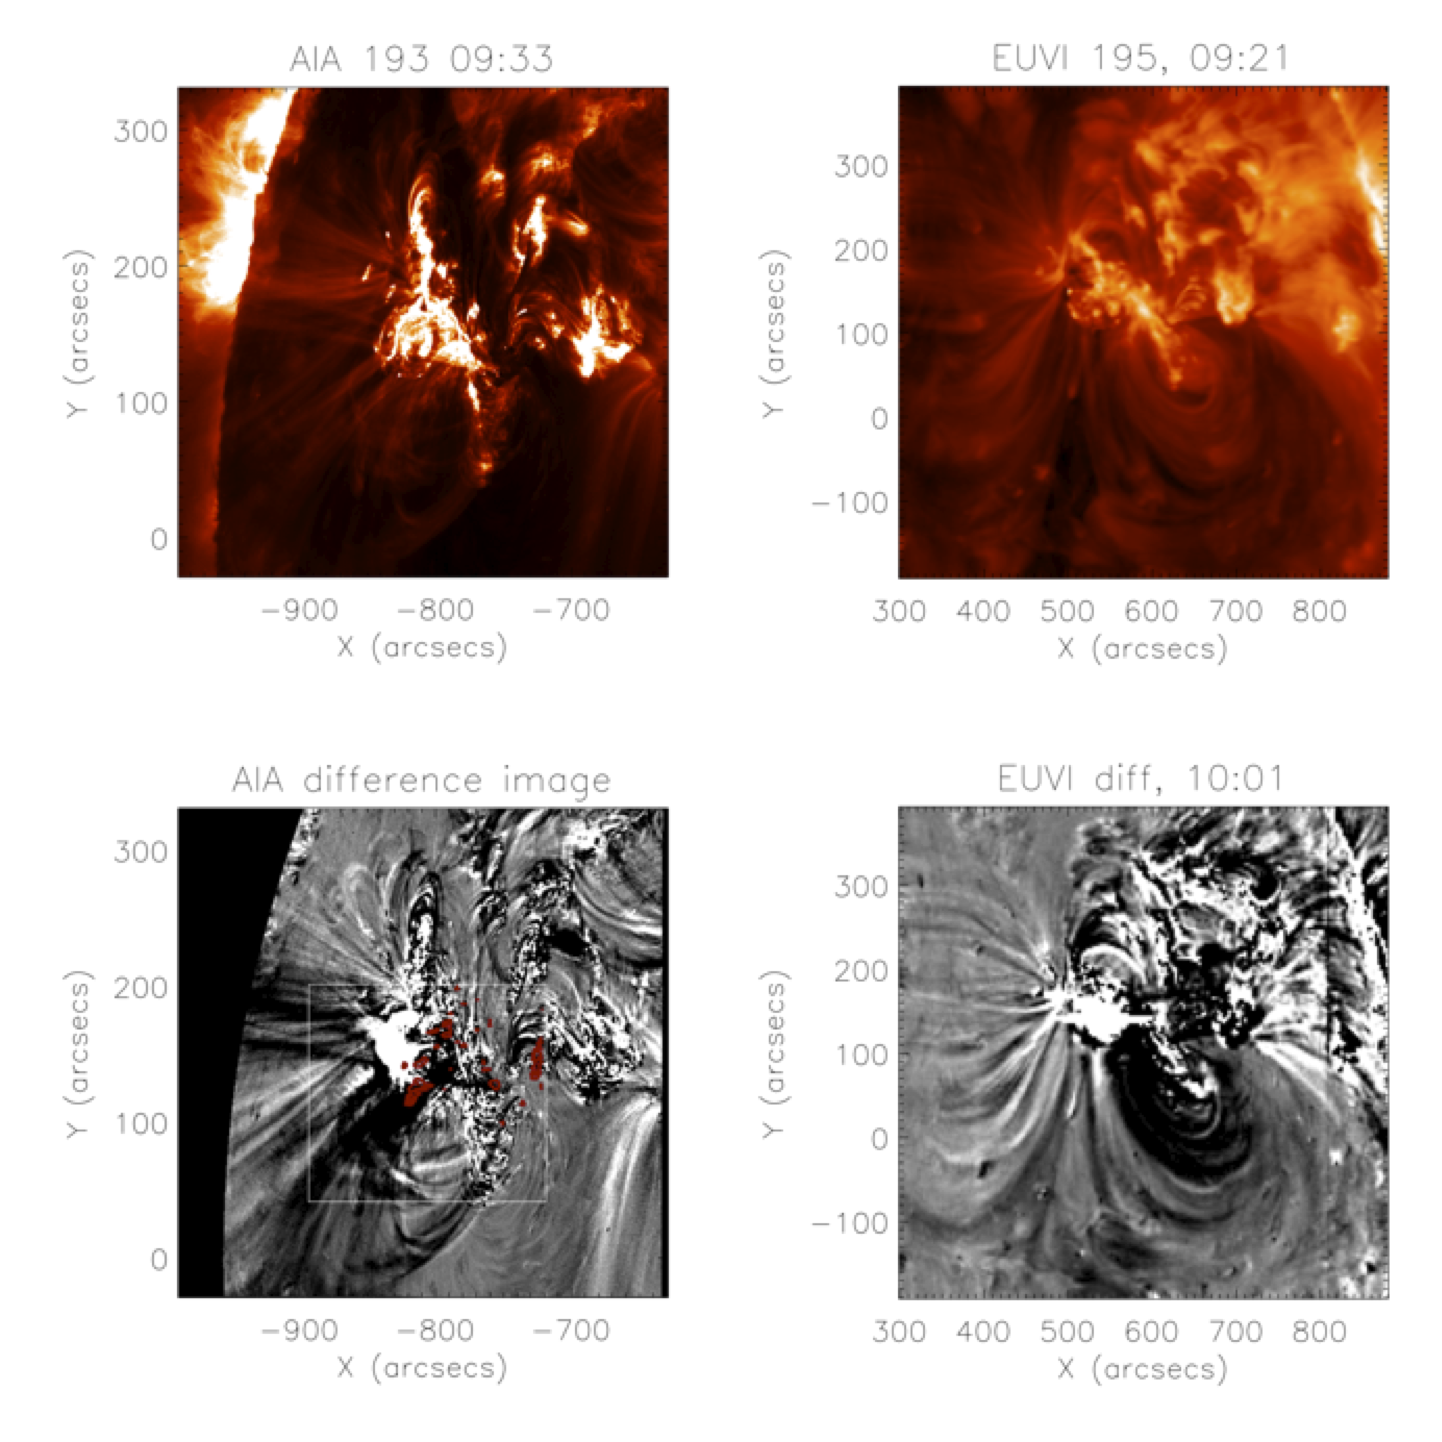
Figure 3: The top two images show AIA and STEREO B EUVI data of the event. The images below are the different images in AIA and EUVI, illustrating the dimming region. The red contours shown on the AIA illustrate where the strong non-thermal velocity is located – it is at the base of the dimming structure.
In all events, pre-flare enhancement in non-thermal velocity at the base of the active region and its surroundings has been found. These enhancements seem to be consistent with the footpoints of the dimming regions, and hence may be highlighting the activation of a coronal flux rope for the three eruptive events. In addition pre-flare enhancements in non-thermal velocity were found above the looptops for the three eruptive events. In summary non-thermal velocity may allow us to probe the location of coronal flux ropes before they erupt.
Next EIS Nugget »» October 2013
Clear Evidence for Hot Fast Flow above a Solar Flare Arcade
Last Revised: 25-Sep-2012
Feedback and comments: webmaster
|


