The Cold Shoulder: Emission Measure Distributions of Active Region Cores
J.T. Schmelz and S. Pathak (University of Memphis)

Recent attempts to determine the mechanisms that transfer and dissipate the energy that heat the solar corona have concentrated on steady versus nanoflare heating. It is the frequency of heating events occurring on a single strand that could distinguish between the different theoretical mechanisms (Klimchuk 2006). If the time between individual heating events is much shorter than the cooling time, then the plasma does not have time to cool or drain between heating events. In this heating scenario, the temperature and density along the strand are effectively steady and the predicted loop intensities and velocities will be approximately constant (Antiochos et al. 2003; Nitta 2000; Warren et al. 2010). If, on the other hand, the time between heating events is much longer than the cooling time, then the plasma is heated to high temperatures (~ 10 MK), then cools and drains without being reheated. In this heating scenario, typically referred to as nanoflares, the resulting temperature and density along the strand will change, and the observed intensity will evolve as well (Terzo et al. 2011; Viall & Klimchuk 2011).
One debate has centered on whether observations of active region cores support steady or nanoflare heating. Constant intensities, densities, Doppler shifts, and nonthermal broadening are consistent with steady heating, but if the spatial scale of the heating is significantly smaller than the resolution of the instrument, direct evidence of nanoflares could be washed out. Confronted with the likelihood of these unresolved structures, recent papers have investigated the emission measure distribution, EMD(T), of active region cores. (Note: the differential emission measure, DEM(T), is related to the emission measure distribution by EMD(T) = T x DEM(T).) Older results reported that the low-temperature side (the "cold shoulder") of the distribution obeyed a power law, EMD(T) ∝ Tb, where 1 < b < 3 (Dere 1982; Dere & Mason 1993; Brosius et al. 1996).
Tripathi et al. (2011) used EIS observations to study the coronal plasma in two active regions. They were careful to avoid the moss and determined EMD(T) results for the coronal emission in four areas in AR 10961 and one in AR 10980. They found EMD(T) ∝ T2.4 for 5.5 < log T < 6.55, which agrees with the results described above and is consistent with both nanoflare and steady heating. Warren et al. (2011) and Winebarger et al. (2011) used observations from EIS and XRT. Warren et al. (2011) found that the EMD for AR 11089 is strongly peaked near 4MK and falls off sharply at both higher and lower temperatures with EMD(T) ∝ T3.3 for 6.0 < log T < 6.6. Winebarger et al. (2011) found a similar result for AR 10955; EMD(T) ∝ T3.2 for 6.0 < log T < 6.5. These distributions are significantly steeper than those of Tripathi et al. (2011) and the older papers. The reason for these differences is an active area of investigation.
Observations
We used EIS and XRT data to examine the EMD(T) for eight different areas in five active regions. We incorporated full disk images from AIA and HMI in order to select areas between positive and negative polarity regions in HMI, taking care to avoid the moss visible in the AIA 171-Å images. Figure 1 shows the AIA 171-Å images from the four data sets. Each white box outlines an area selected for analysis using the criteria described above. The HMI images in Figure 2 show the magnetic structure of the active regions.
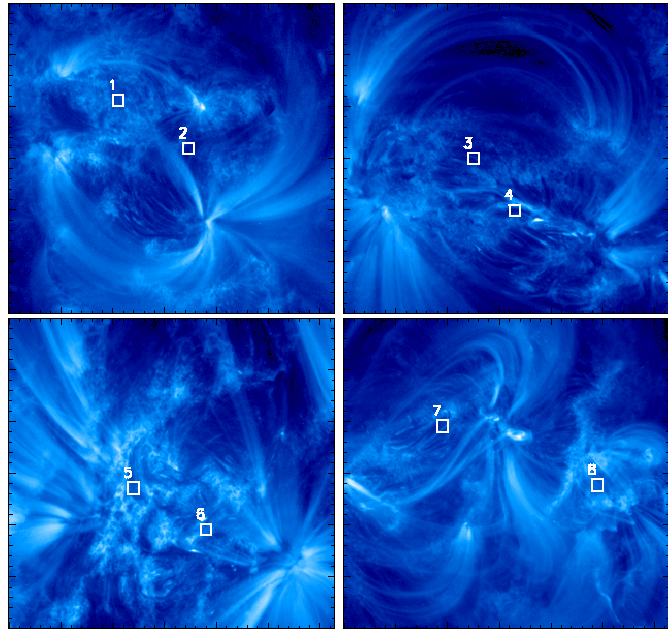
Figure 1: AIA 171-Å images of AR 11113 at N17W17 observed on 2010 October 20,
AR 11190 at N13W26 observed on 2011 April 15, AR 11339 at N18E43 observed on 2011 November 4, and AR 11382 at S14W23 and AR 11381at S15W30 observed on 2011 December 22. The white boxes in each image depict the inter-moss areas selected for detailed analysis.
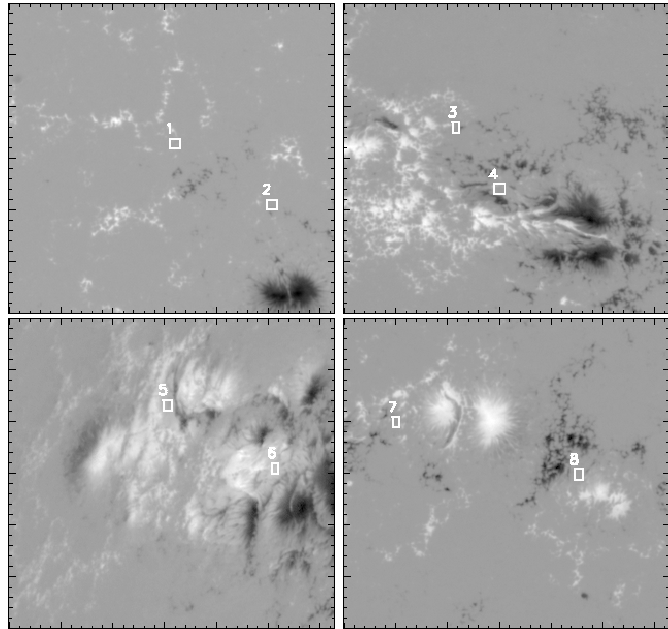
Figure 2: HMI magnetograms of the regions selected for analysis. For details, see Figure 1.
Analysis
Multithermal analysis of coronal active region cores is particularly challenging since most instruments are sensitive to either the lower- or the higher-temperature plasma, but not both. Most modern EUV imagers and spectrometers (e.g., TRACE, EIT, CDS, EIS) have excellent diagnostics for the cooler-end of active region temperatures, but the highest-temperature (strong, unblended) lines observable are Fe XV or Fe XVI, with peak formation temperature of Log T = 6.3 and 6.4, respectively. This is not high enough to constrain effectively the warmer active region plasma. X-ray imagers and spectrometers (e.g., XRT, SXT, SMM FCS, SMM BCS) have the opposite problem; they have great high-temperature diagnostics, but the coolest lines are usually O VII or O VIII, with peak formation temperature of Log T = 6.1 and 6.2, respectively.
One way researchers have gotten around this problem is to use data from two different instruments. EIS and XRT were designed in part to work together. They have the same spatial resolution and cover different but overlapping coronal temperature ranges. These properties make a combined data set ideal for multithermal analysis, where the EIS iron lines provide the best information on the cooler corona (Log T < 6.5) and the XRT iron-dominated filters provide the best information on the hotter corona (Log T > 6.5).
Atomic physics data were obtained from the CHIANTI version 7.0 (Dere et al. 1997; Landi et al. 2012) data base. The contribution functions for the EIS lines and the response functions for the XRT filters used the coronal abundances of Schmelz et al. (2012), an update of the hybrid abundances of Fludra & Schmelz (1999). We also used the ionization balance calculations of Bryans et al. (2009).
Our first estimate of the plasma density for each region was determined from the Fe XII 186.88-to-195.12-Å density-sensitive pair. We then refined this estimate using the DEM-weighted density technique described by Schmelz et al. (2011). We used this density, the EIS Fe IX-Fe XVI lines, and the XRT filter(s) to produce an EMD curve for each active region core area. We use xrt_dem_iterative2 for our multithermal analysis (Weber et al. 2004). These results are shown in Figure 3. The Monte Carlos from xrt_dem_iterative2 are shown in red and the minimum χ2 result in black. For each EIS line or XRT filter flux, we used the statistical uncertainty or 10%, whichever was greater. The tightness of the Monte Carlos in the temperature range of interest (Log T = 6.0 to the EMD peak) is encouraging, showing that the EMD shape is well constrained by the data. The one exception is region (4) from 2011 Apr 15. Although there were Al_Mesh and Ti_Poly XRT observations for the region, one of the XRT contamination spots sat right in the target area. We include it in our analysis to emphasize the need for XRT data to provide the high-temperature constraint for our multithermal analysis of active region cores. For the other regions, the Monte Carlos begin to deviate at both higher (above Log T ~ 6.6) and lower (below Log T ~ 6.0) temperatures, indicating that the EMD results are not well constrained in these ranges.
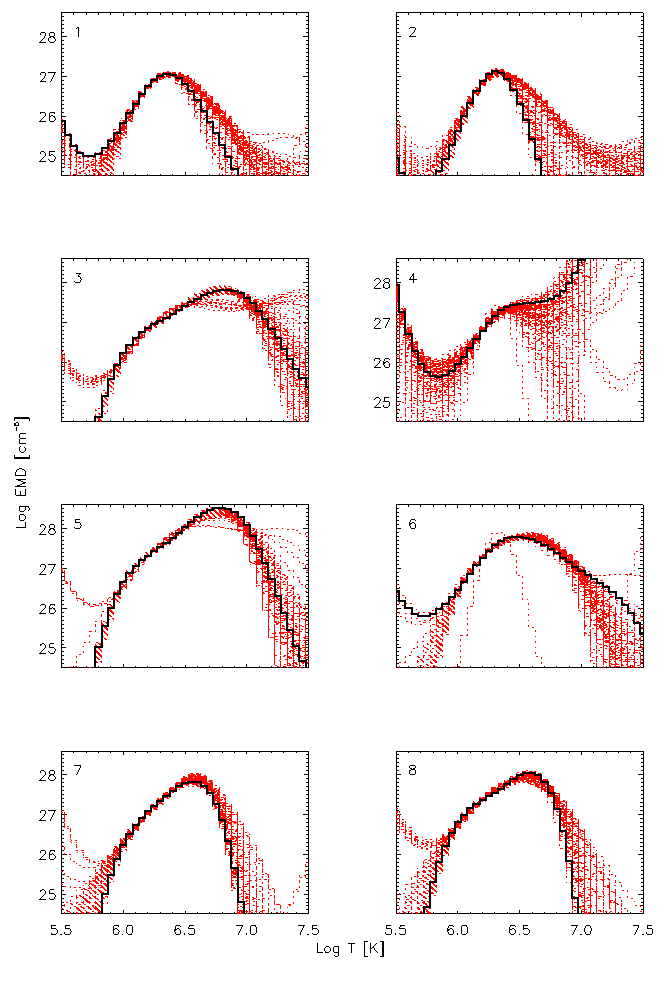
Figure 3: EMDs for each active region core area created using xrt_dem_iterative2. The Monte Carlos are shown in red and the minimum χ2 result in black. The tightness of the Monte Carlos in the temperature range of interest (Log T = 6.0 to the EMD peak) shows that the shape of the distribution is well constrained by the data. The one exception is region (4), where the XRT data were compromised by a contamination spot, and no high-temperature constraint was available.
Discussion
The result of our analysis, b, in EMD(T) ∝ Tb, is the "cold shoulder" slope in the Log -Log plots of Figure 3. Since our lowest temperature EIS iron line is Fe IX, with a peak formation temperature of Log T = 5.90, we have set the low-temperature limit of our slope calculations at Log T = 6.0 for all regions. The high-temperature limit is the peak of the EMD(T) curves. For AR 11113, which was observed by EIS and XRT on 2010 October 20, the "cold shoulder" slope is steep for both region (1) with b = 4.03 and region (2) with b = 5.17. The steep drop off on both the high- and low-temperature sides of the distribution is reminiscent of the results from the steady heating model discussed by Winebarger et al. (2011). This model was for a warmer, more magnetically complex active region, but nevertheless suggests that the EMD results for AR 11113 are consistent with steady heating.
Following recent results by O'Dwyer et al. (2013), we have determined the age of AR 11113 at the time of our observations. AIA shows that the region rotated over the east limb on ~2010 October 13, but that it was already fairly substantial at that time. Using Stereo A and B, which are currently in positions that can image the far side of the Sun, we were able to follow the evolution of AR 11113 back to 2010 September 26. This would make the region 24 days old at the time of observations.
For AR 11190, which was observed by EIS and XRT on 2011 April 15, the "cold shoulder" slope for region (3) is b = 1.91. AIA, Stereo A, and Stereo B images show us that the region formed on ~2011 March 30, making it 16 days old at the time of our observations; the slope for region (4) cannot be determined reliably because of the XRT contamination spot issue discussed above. For the 2011 November 4 observations of AR 11339, b = 2.84 for region (5) and with b = 2.20 for region (6). There were no Stereo data available, so we used the GONG far side images to trace the origin of the active region to ~2011 October 26, making it 9 days old at the time of our observations. For the 2011 December 22 observations of AR 11382, b = 2.31 for region (7) and of AR 11381, b = 2.64 for region (8). AIA, Stereo A, and Stereo B images show us that the regions formed on ~2011 December 12, making them 10 days old at the time of our observations.
Conclusions
We have used EIS, XRT, and xrt\_dem\_iterative2 to determine the EMD(T) of eight inter-moss areas located in the cores of five different active regions. We then calculated b, where EMD(T) ∝ Tb, between Log T = 6.0 and the temperature of the peak of the EMD. For regions (1) and (2) in AR 11113 the exponents were rather large, indicating that steady heating was most likely dominating. The steady-heating model of Winebarger (2011) resembles the EMD for these regions.
For regions (3) and (5-8), b was lower, indication nanoflare heating. Our results are consistent with those of O'Dwyer et al. (2013), who suggested that active region age could be a strong indicator of the dominant heating. Older regions are more likely to be dominated by steady heating, while younger regions show more evidence of nanoflares.
References
---------------
Antiochos, S.K., Karpen, J.T., DeLuca, E.E., Golub, L., Hamilton, P. 2003, ApJ, 590, 547
Brosius, J.W., Davila, J.M., Thomas, R.J., Fossi, B.C. 1996, ApJS, 106, 143
Bryans, P., Landi, E., Savin, D.W. 2009, ApJ, 691, 1540
Dere, K.P. 1982, Sol. Phys., 77, 77
Dere, K.P., Landi, E., Mason, H.E., Monsignori Fossi, B.C., Young, P.R. 1997, A&AS, 125,
149
Dere, K.P., & Mason, H.E. 1993, Sol. Phys., 144, 217
Fludra, A. & Schmelz, J.T. 1999, A&A, 348, 286
Klimchuk, J.A. 2006, Sol. Phys., 234, 41
Landi, E, Del Zanna, G., Young, P.R., Dere, K.P., Mason, H.E. 2012, ApJ, 744, 99
Nitta, N. 2000, Sol. Phys., 195, 123
O’Dwyer, B., Tripathi, D. and Mason, H.E., 2013, A&A letters, in preparation
Schmelz, J.T., Reames, D.V., von Steiger, R., Basu, S. 2012, ApJ, 755, 33
Schmelz, J.T., Rightmire, L.A., Saar, S.H., Kimble, J.A., Worley, B.T. 2011, ApJ, 738, 146
Terzo, S., Reale, F., Miceli, M., Klimchuk, J.A., Kano, R., Tsuneta, S. 2011, ApJ, 736, 111
Tripathi, D., Klimchuk, J.A., Mason, H. E. 2011, ApJ, 740, 111
Viall, N.M, Klimchuk, J.A. 2011, ApJ, 738, 24
Warren, H.P., Brooks, D.H., Winebarger, A.R. 2011, ApJ, 734, 90
Warren, H.P., Winebarger, A.R., Brooks, D.H. 2010, ApJ, 711, 228
Weber, M.A., DeLuca, E.E., Golub, L. & Sette, A.L. 2004, Proc. IAU Symp. 223, Multi-
Wavelength Investigations of Solar Activity, 321
Winebarger, A.R., Schmelz, J.T., Warren, H.P., Saar, S.H., Kashyap, V.L. 2011, ApJ, 740,
2
Next EIS Nugget »» coming later...
TBC
Last Revised: 25-Sep-2012
Feedback and comments: webmaster
|


