Clear Evidence for Hot Fast Flow above a Solar Flare Arcade
Imada S., Aoki K., Hara H., Watanabe T., Harra L. K., and Shimizu T.

The standard eruptive flare model predicts that magnetic reconnection occurs high in the corona where hot fast flows are created. Some imaging or spectroscopic observations have indicated the presence of these hot fast flows above the flare arcades, but there have been no spectroscopic scanning observation to date to measure the two-dimensional structure quantitatively. We analyzed a flare that occurred on the west solar limb on 27 January 2012 observed by the Hinode EUV Imaging Spectrometer (EIS) and found that the hot (~30MK) fast (>500 km/s) component was located above the flare loop. This is consistent with magnetic reconnection taking place above the flare loop.
The AIA images taken in the different channels show the behavior of the flare loop structure at different temperature (Figure 1). To clarify whether the hot (a few 10 MK) Alfvenic flows (~1000 km/s) are located above the flaring loops or not, as predicted by CSHKP model, we analyze the AIA images. The downward (sunward) moving features above the flare arcades in the highest temperature range (193-A channel) are clearly observed. Even in the 131-A channel we can also see some downward moving features, but in the 94-A channel, as the temperature decreases, there are no clear signature of flows. This can be interpreted as evidence for the hot downward moving loops. To estimate the apparent velocity of downward moving loops, we carry out the time-distance analysis and found the patterns in the flow with transverse velocity with a typical value of 350 km/s.
The blue-wing (Figure 2a), the line-center (Figure 2b), and the red-wing (Figure 2c) images of FeXXIV observed by EIS are shown. In the northeastern part of flare, where AIA observations show the hot and fast apparent flow, we can see the diffuse structures in the blue-wing image (Figure 2a), which cannot be seen in the line-center image (Figure 2b). This diffuse structure, seen only in the blue-wing image, is indicating a response to the magnetic reconnection occurring above, and creating strong outflows. Figure 2d-f show the FeXXIV line profile observed each location (+, o, x). Figure 2d shows an example of the FeXXIV line profile in the region where the blue-wing is enhanced (+ mark in Figure 2a-c). The profile is a strongly distorted line profile. The distortion extends beyond -400 km/s, which indicates that there are fast plasma flows toward Hinode.
EIS successfully reveals hot fast flows above the flare arcades through the observation of Doppler shifts. Figure 3 shows the summary of observation.
Reference:
Imada et al. 2013, ApJ Letters, 776, L11, at: http://iopscience.iop.org/2041-8205/776/1/L11/
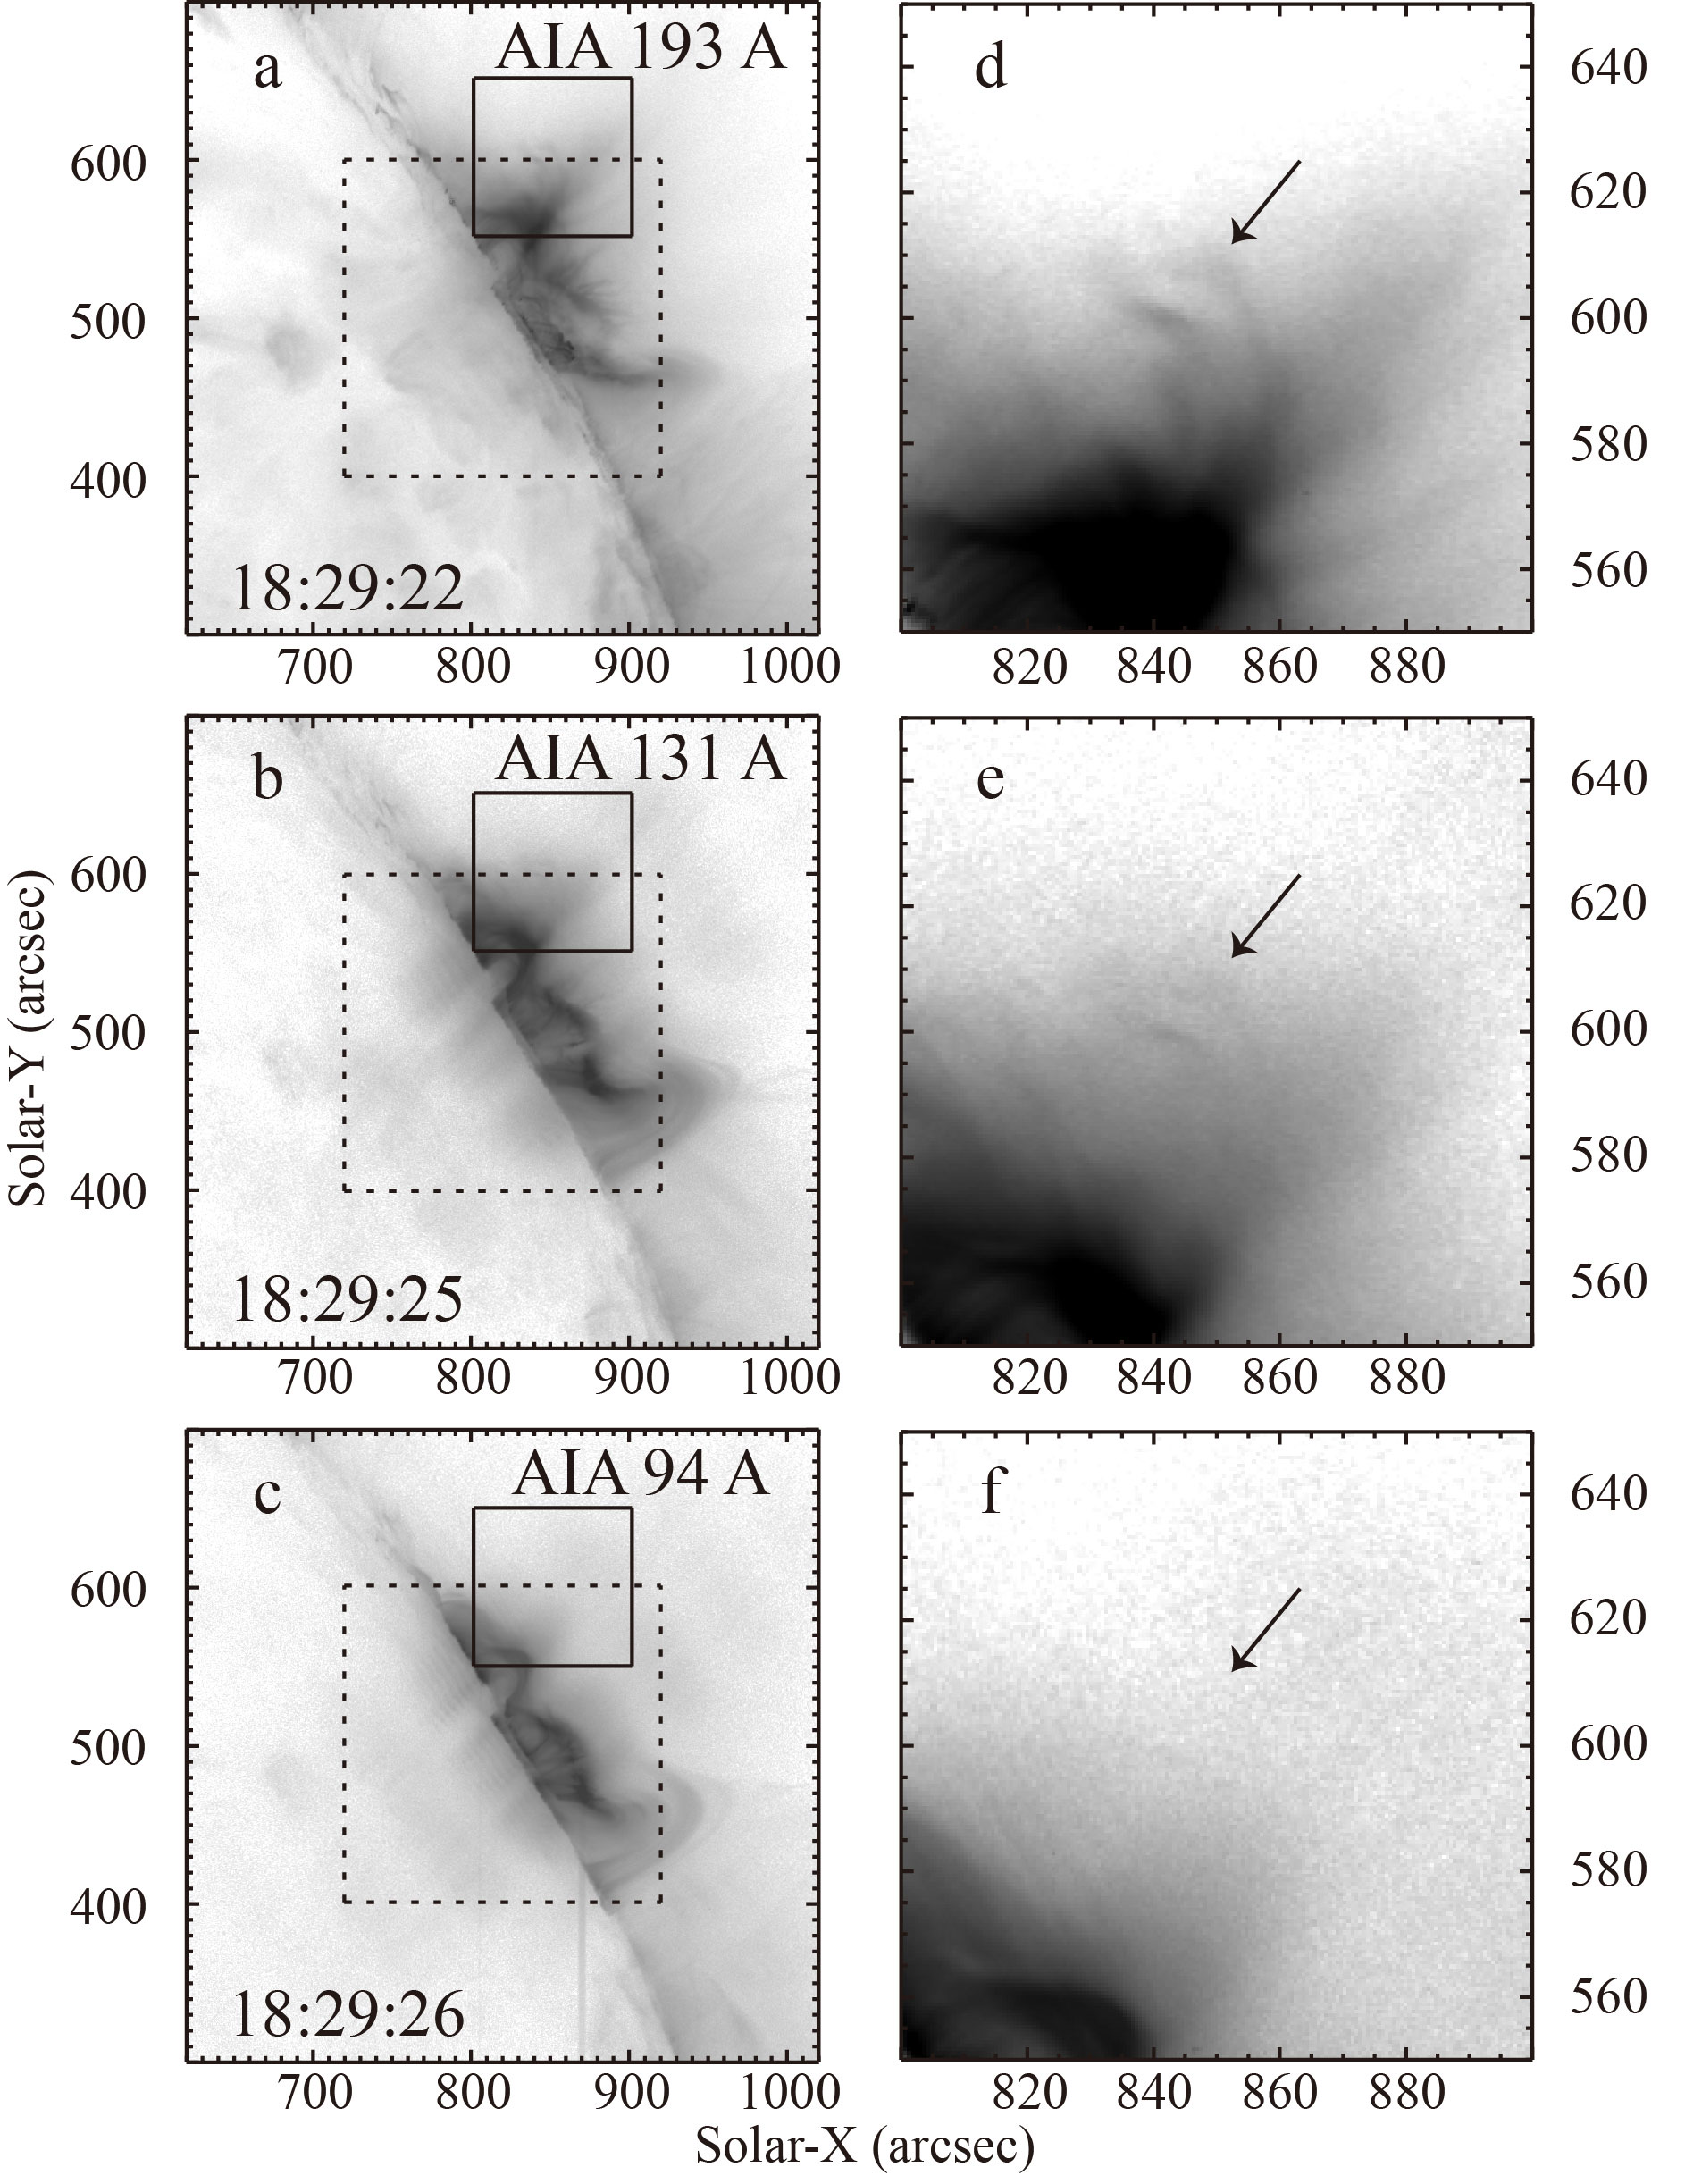
Figure 1: Snapshots of the flare on 27 January 2012. The EIS field of view is indicated by the dashed box. (a) AIA 193-A channel image. (b) AIA 131-A channel image. (c) AIA 94-A channel image. (d-f) Enlarged display inside the solid box in a-c. The arrows show the location of downward moving loop.
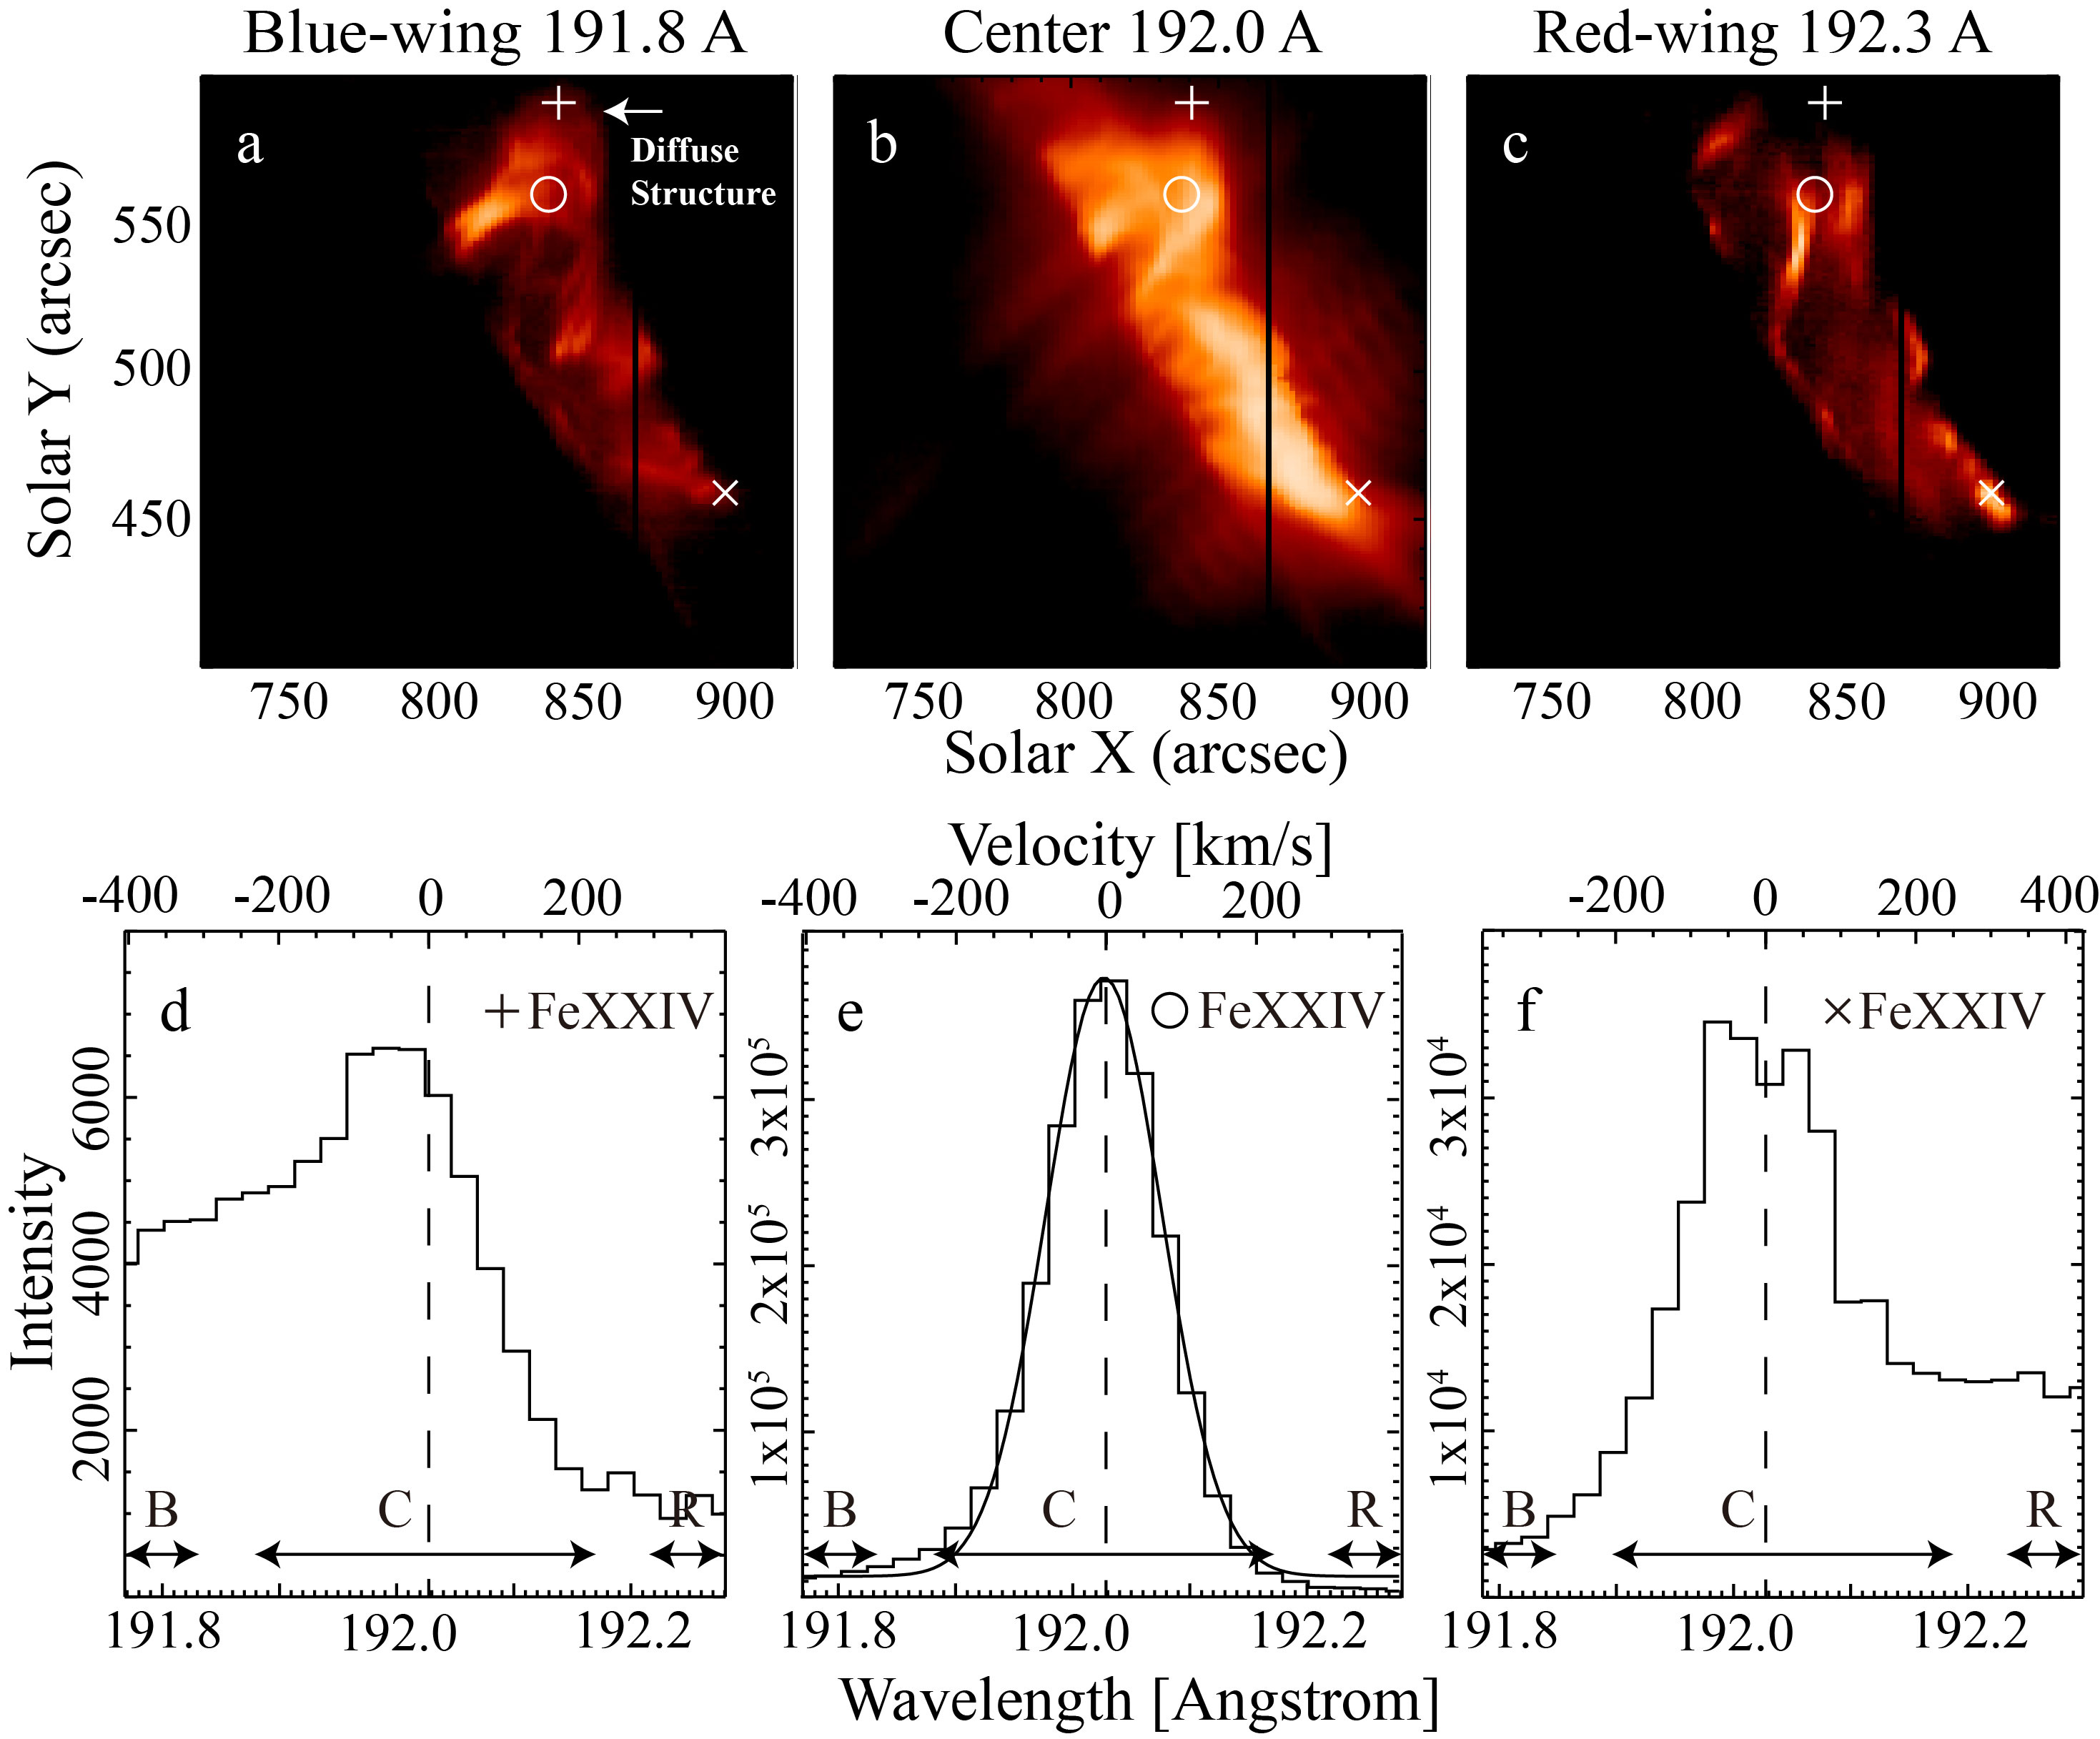
Figure 2: (a) EIS FeXXIV blue-wing image (191.8 A, -400 km/s) of the flare on 27 January 2012. (b) EIS FeXXIV center image (192.0 A, 0 km/s) of the flare. (c) EIS FeXXIV red-wing image (192.3 A, 400 km/s) of the flare. (d) The example of FeXXIV line profile in the blue-wing enhanced region (+ mark in Fig. 2a-c). (e) The example of FeXXIV line profile in the center of the flare (circle mark in Fig. 2a-c). (f) The example of FeXXIV line profile in the red-wing enhanced region (x mark in Fig. 2a-c). The ranges B, C, and R in Fig. 2d-f represent the blue-wing, center, and red wing of FeXXIV, respectively.
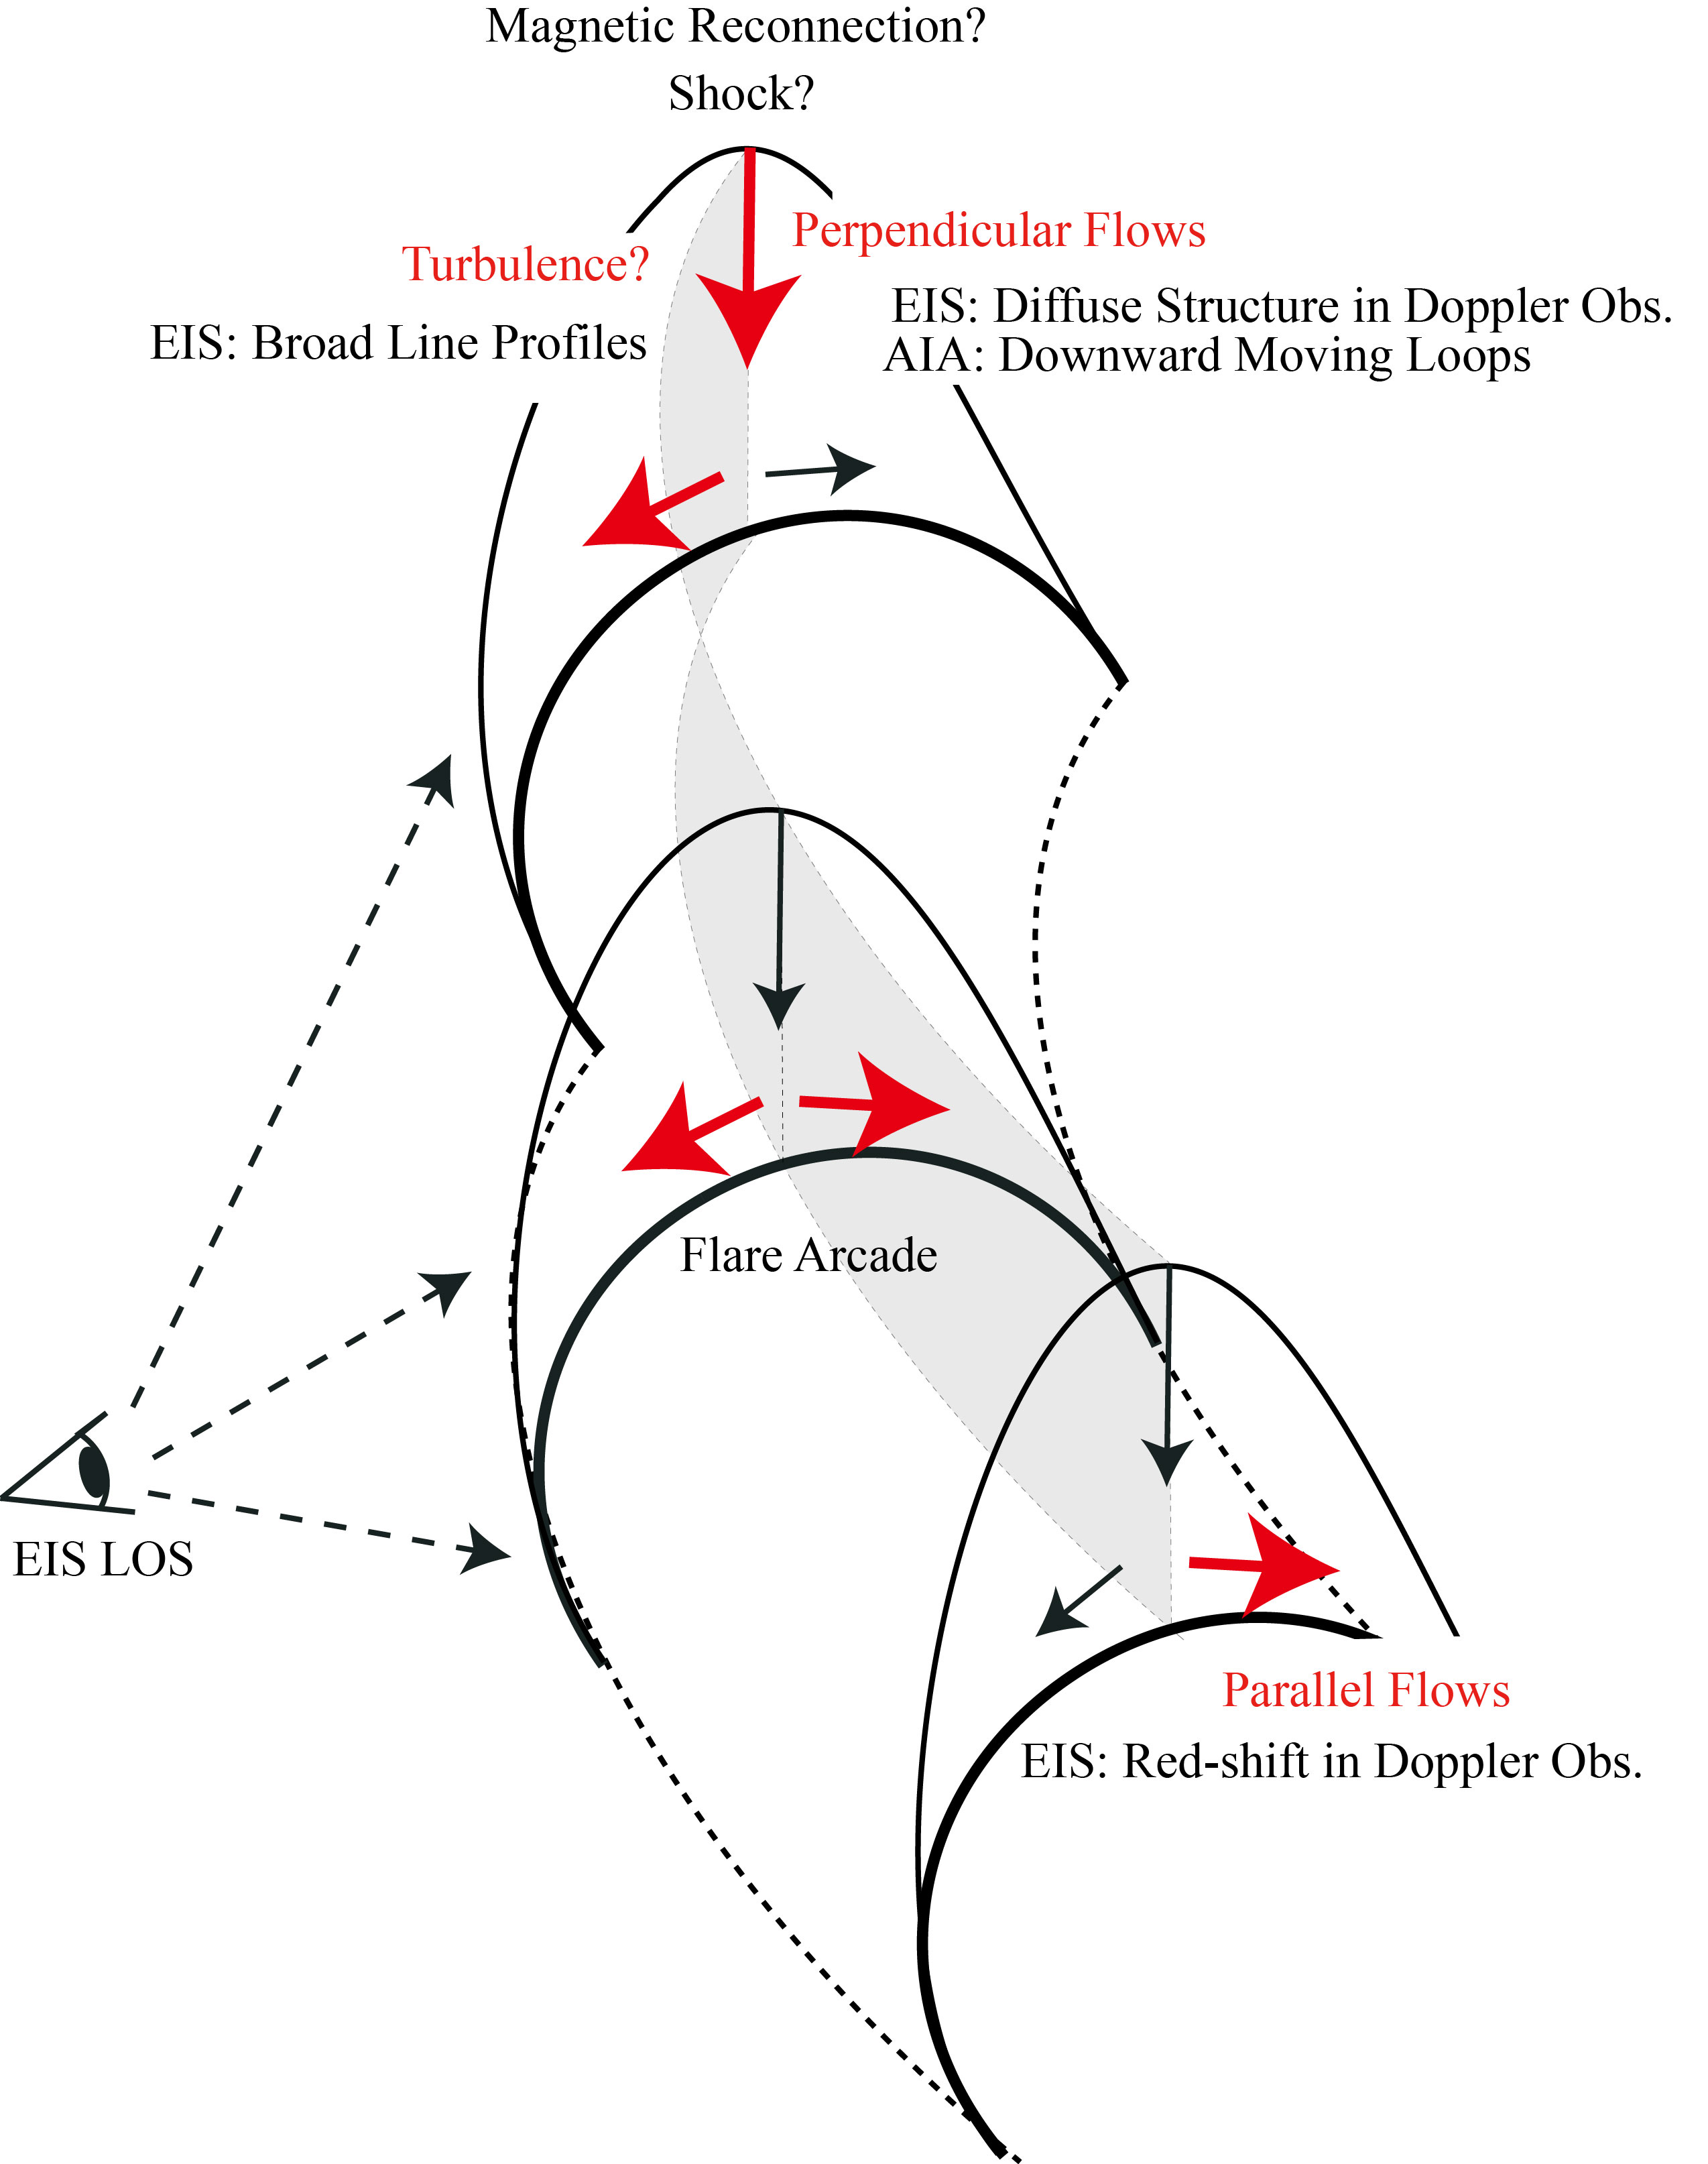
Figure 3: Schematic illustration of the X-class flare on 27 January 2012. The large arrows demark the flow signatures observed by EIS Doppler velocity. The small arrows are flows which cannot be observed by EIS Doppler velocity because of LOS effect. The entire flare arcade structure is defined by the combination of AIA and other view angle observation (STEREO). The figure is illustrated from STEREO viewpoint. EIS and AIA view from left-hand side of the figure.
Next EIS Nugget »» coming later...
TBC
Last Revised: 26-Sep-2013
Feedback and comments: webmaster
|


