Rapid Evolution of the Solar Atmosphere During a Microflare Observed with EIS:
Hints of Chromospheric Magnetic Reconnection
Jeff Brosius (Catholic University of America at NASA/Goddard)

In the standard model of solar flares, energy stored in non-potential magnetic
fields is released by reconnection in the corona. This energy heats the local
plasma to temperatures around 10 MK and/or accelerates nonthermal particles, and
is subsequently transported by thermal conduction and/or particle beams (and
possibly also Alfven waves) through the relatively tenuous corona to the
chromosphere, where it is stopped in the cooler, denser plasma. The possibility
that flare reconnection occurs in the chromosphere itself has been mentioned by
Brosius & Holman (2009).
Observations
We used the FLAREDOP_EIS study (Brosius 2013a) to acquire a series of rapid
cadence (11.2 s) stare spectra of a microflare on 2012 November 21. For a
detailed description of this investigation, see Brosius (2013b). The spectra
include emission lines of Fe XVI at 262.976 A, Fe XXIII 263.766 A, Fe XIV
264.789 A, Mg VI 268.991 A, Fe XIV 274.204 A, and Si VII 275.361 A, where the
wavelengths are adopted from CHIANTI version 7.0 (Dere et al. 1997, Landi et al.
2012). Of particular importance to what follows are the facts that:
(1) The Fe XIV line at 264.789 A is blended with a much weaker Fe XI line at
264.773 A. While the Fe XIV line provides a valuable diagnostic of flare
plasma around log T = 6.27, we caution that emission from Fe XI may produce
enhancements in the blue wing that are not due to Fe XIV. The rest wavelength
of the Fe XI line corresponds to a Doppler blueshift (negative velocity) of
-18.1 km/s relative to the rest wavelength of Fe XIV. (2) The Fe XIV line at 274.204 A is blended with a weaker Si VII line at 274.180 A that can be removed from the total integrated intensity at 274.204 A (Young et al. 2007) by using the intensity ratio Si VII 274.180/275.361 = 0.226
+/- 0.039, where the uncertainty indicates ratio variations between log n_e =
9.0 and log n_e = 11.0. The rest wavelength of the Si VII line corresponds to a
Doppler blueshift of -26.3 km/s relative to the rest wavelength of Fe XIV.
Figure 1 displays the EIS slit pointing overplotted on images from AIA's 131 and
1600 A channels at selected times during the flare. Flare emission for this
event was confined almost exclusively to 12 slit y-pixels over which we averaged
the spatially resolved spectra to obtain a time series of 300 spectra. We
followed Kamio et al. (2010, 2011) to correct for wavelength drift as function
of both time and slit pixel in order to extract reliable relative Doppler
velocities. Here, "relative" refers to shifts in wavelength during the flare
compared to wavelengths measured during a quiescent time interval prior to the
flare. The uncertainty on the drift corrections is 4.4 km/s.
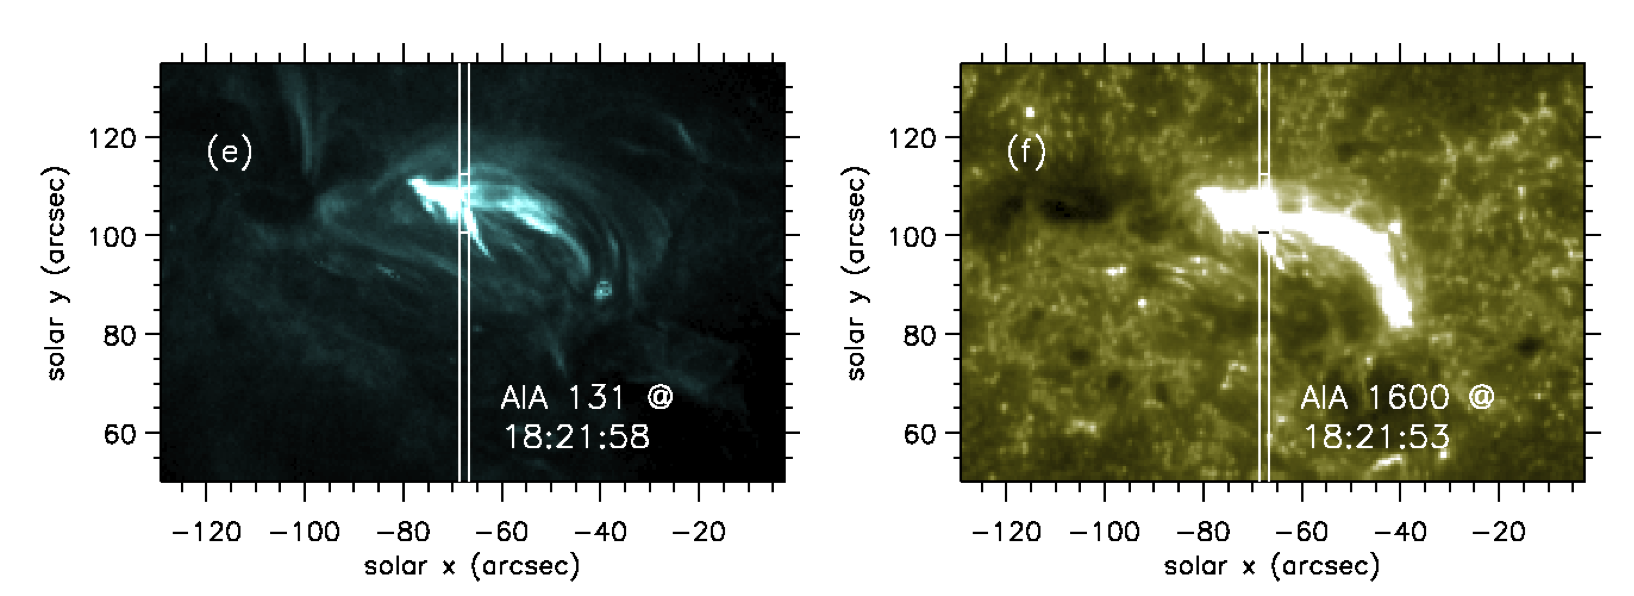
Figure 1: AIA 131 and 1600 A images obtained near the microflare's
impulsive intensity peak, with the EIS slit overplotted. The horizontal lines
within the slit indicate the 12-arcsec segment from which the spatially averaged
EIS spectra were obtained.
Results
(1) Starting Time of the Flare: Figure 2 shows light curves for three of the
six lines listed above. The pre-flare quiescent interval of nearly constant,
relatively low intensity is indicated with solid red vertical lines. We
consider the flare to have commenced in any given emission line when that line's
intensity first exceeds its pre-flare quiescent average value by more than the
3-sigma scatter therein, and remains so elevated until the end of the flare.
The light curves indicate that the flare started earlier in its transition
region emission (Mg VI and Si VII, at 18:20:01.9 UT) than it did in its hottest
emission (Fe XVI and Fe XXIII, at 18:20:29.8 +/- 05.6 UT). This rules out
thermal conduction from a directly heated coronal source as the mechanism by
which energy is transported to the chromosphere.
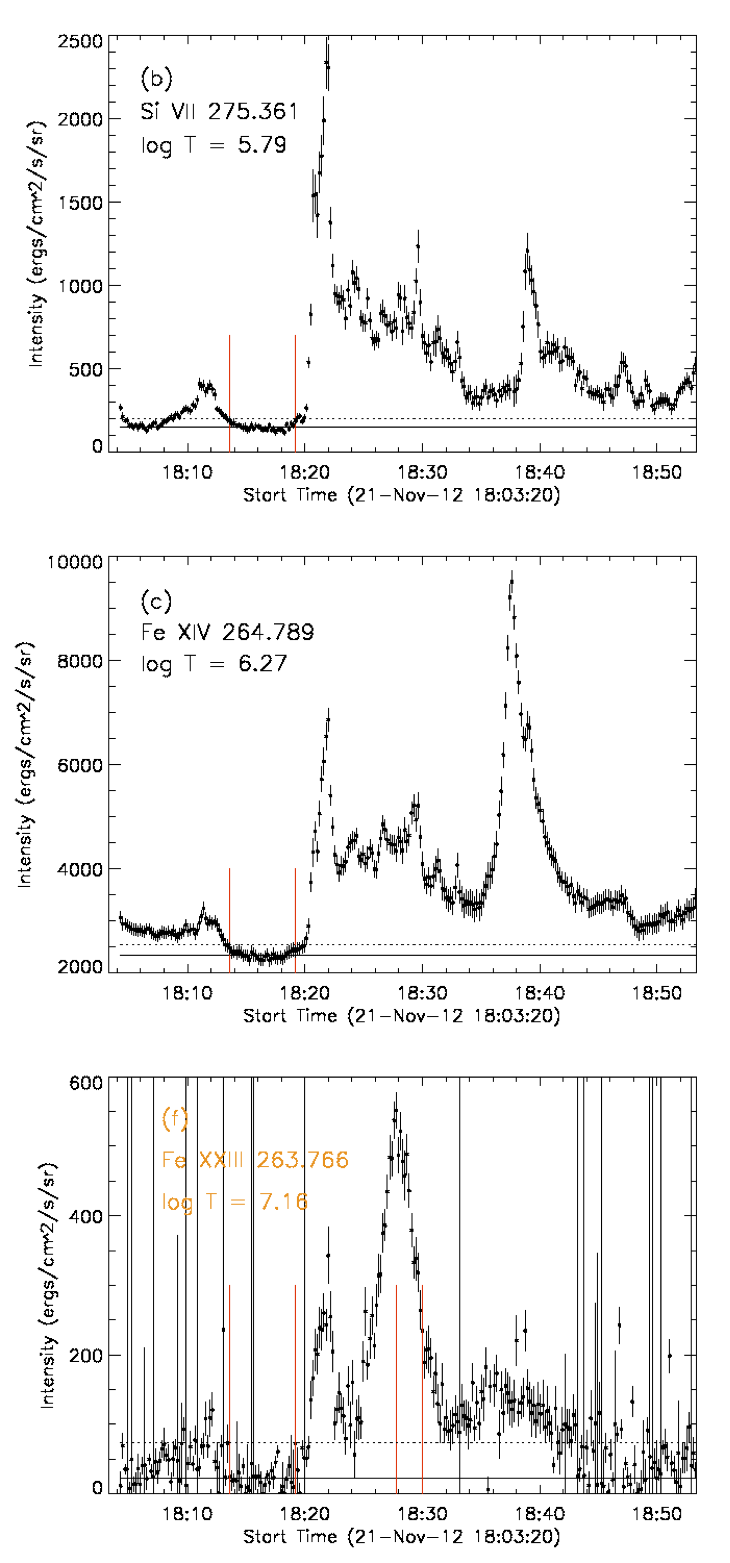
Figure 2: Light curves derived from single Gaussian fits to lines of
Si VII at 275.361, Fe XIV 264.789, and Fe XXIII 263.766 A observed with
FLAREDOP_EIS, for the time series of spatially averaged spectra. The pre-flare
quiescent interval from which all ``reference" values (except the wavelength and
width of Fe XXIII) are obtained is indicated with solid red vertical lines; the
(later) flare interval from which the Fe XXIII reference wavelength and width
are obtained is also indicated with solid red vertical lines. In each frame the
solid black horizontal line indicates the pre-flare quiescent average intensity,
and the dotted line indicates 3 sigma above this average. The Fe XXIII
impulsive phase peak intensity was a factor of 4 smaller than that observed
during the flare reported by Brosius (2013a), so the Fe XXIII profile fits and
quantities derived therefrom are much less reliable than in the earlier case.
(2) Nonthermal Turbulent Velocities: Nonthermal velocities are derived for any
given line by removing both the EIS instrumental width (Young 2011) and the
line's thermal width from its measured width. This yields pre-flare quiescent
nonthermal turbulent velocities of 20 - 28 km/s in the transition region and
coronal lines. Recognizing that the sources of the pre-flare quiescent emission
and the flare emission are not necessarily the same, but may occur at different
heights along the line of sight, we fit two Gaussian components to each emission
line during the flare (except Fe XXIII, which is absent in the pre-flare
quiescent interval): a quiescent component whose fit parameters are held
constant, and a flare component whose fit parameters are variable. Examples of
these two-component fits to the Si VII 275.361 and Fe XIV 264.789 A lines during
the impulsive rise of the flare are shown in Figure 3. The nonthermal turbulent
velocity of the flare component is about 3 times larger than that of the
pre-flare quiescent component for all of the lines.
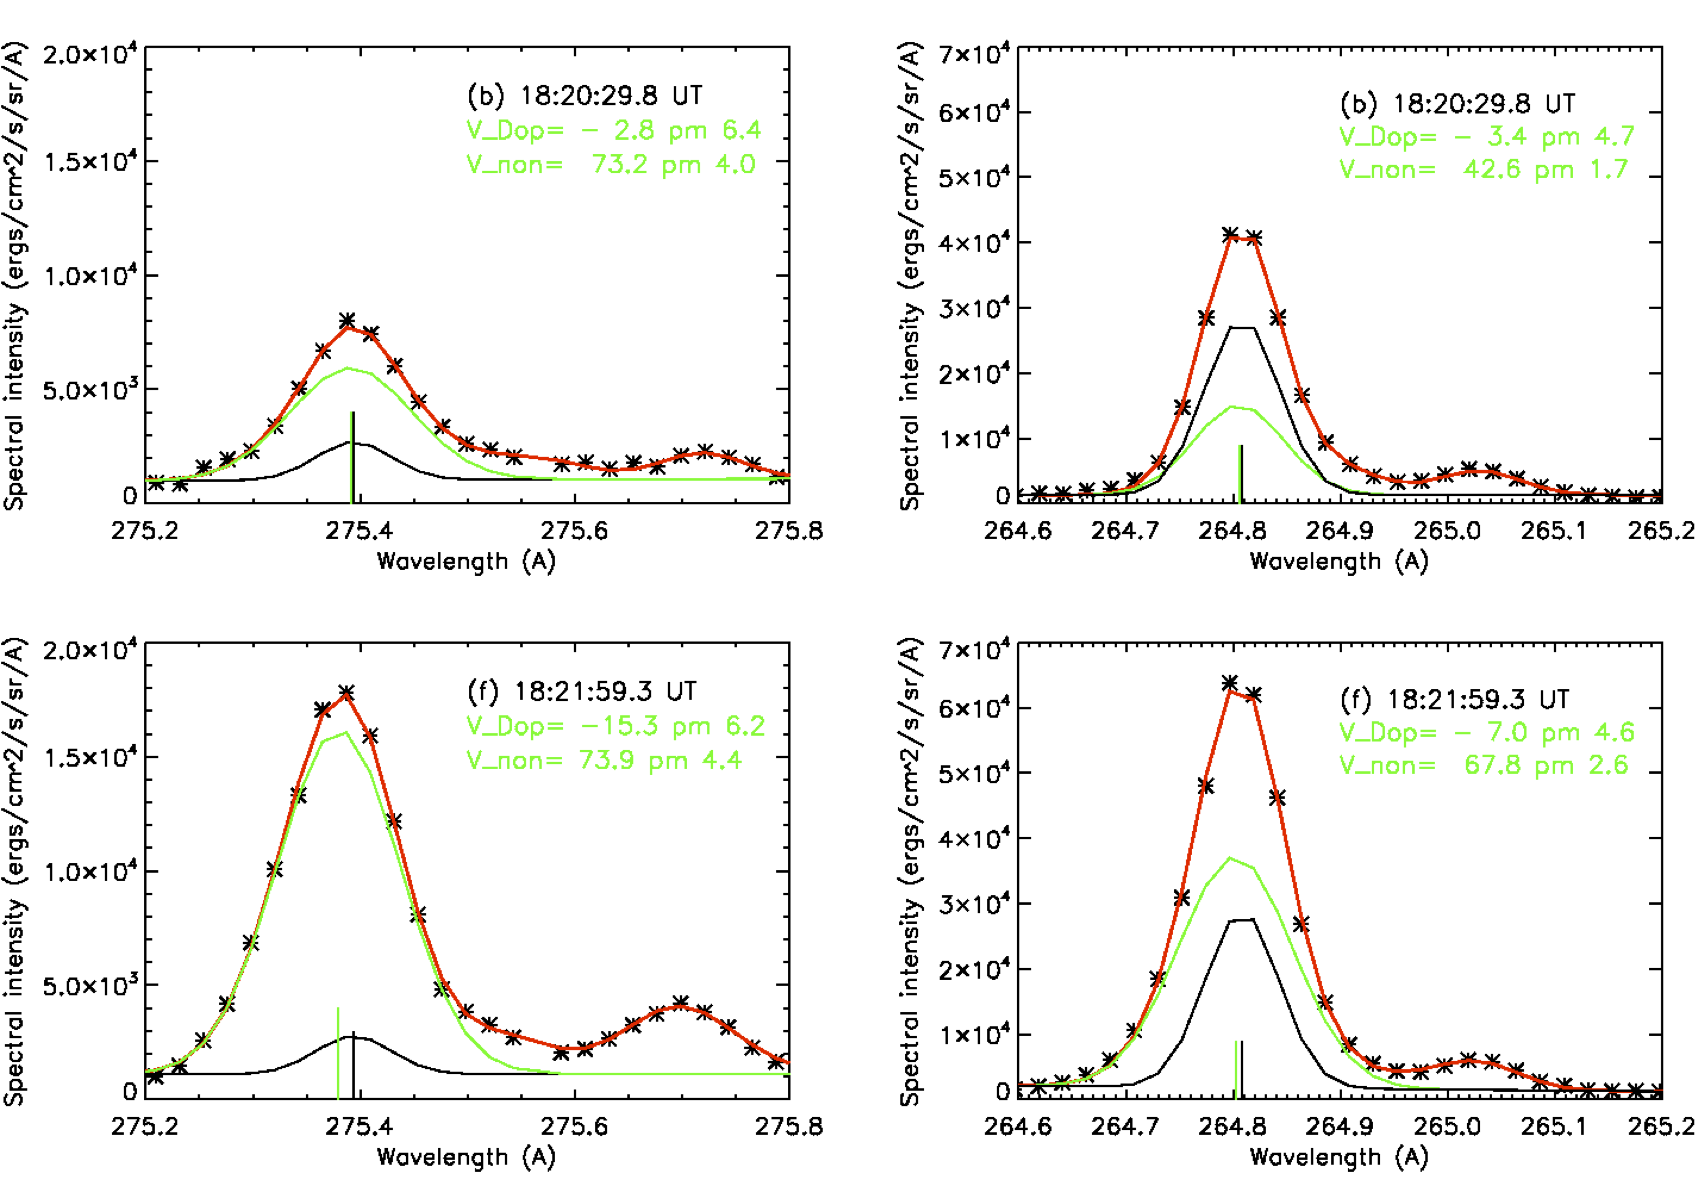
Figure 3: Sample profiles of the Si VII line at 275.361 A (with Fe
XVII 275.550 and Si VII 275.676 A) and Fe XIV at 264.789 A (with Fe XVI 265.001
A) at two different times during the impulsive rise of the flare. Asterisks
correspond to the observed spectrum, the red line indicates the overall fit to
the observed spectrum, the black line indicates the pre-flare profile (held
constant), and the green line indicates the flare-source profile (the variable
profile that is fit in each flare exposure). The time of the exposure from
which each profile was obtained is indicated in the upper right, along with the
relative Doppler velocity and the nonthermal turbulent velocity of the flare
component.
(3) Relative Doppler Velocities: We derived relative Doppler velocities (Figure
4) for each line during the flare based on shifts between the line's reference
wavelength and the centroid of its flare component in the two-component fits
(Figure 3); for Fe XXIII we use only a single-component fit. The blueward
offsets of the Fe XI and Si VII lines blended with the Fe XIV lines may
effectively magnify a smaller blueshift due to Fe XIV alone, or introduce non-Fe
XIV blueshifts into the flare components of both lines. The key point is that
the velocities are much smaller than typical evaporative upflows and they do not
display a pattern consistent with evaporative filling of flare loops. None of
the lines in this investigation shows a flow pattern like that observed in Fe
XXIII emission by Brosius (2013a), where the line showed an enduring,
systematic, relatively large upflow (maximum value around -200 km/s) until the
intensity reached its maximum value, when the velocity ceased. Those
observations were consistent with chromospheric evaporation theory, in which an
observed line's intensity increases while evaporated material moves upward to
fill overlying magnetic loops. In the present case (Brosius 2013b), none of the
lines exhibit systematic, significant upflows starting at flare onset. The Mg
VI, Si VII, and Fe XIV lines do eventually show systematic blueshifted emission,
but in all cases the upflows extend beyond the initial impulsive intensity peak
(Figure 4), and the maximum upward velocity occurs after that peak.
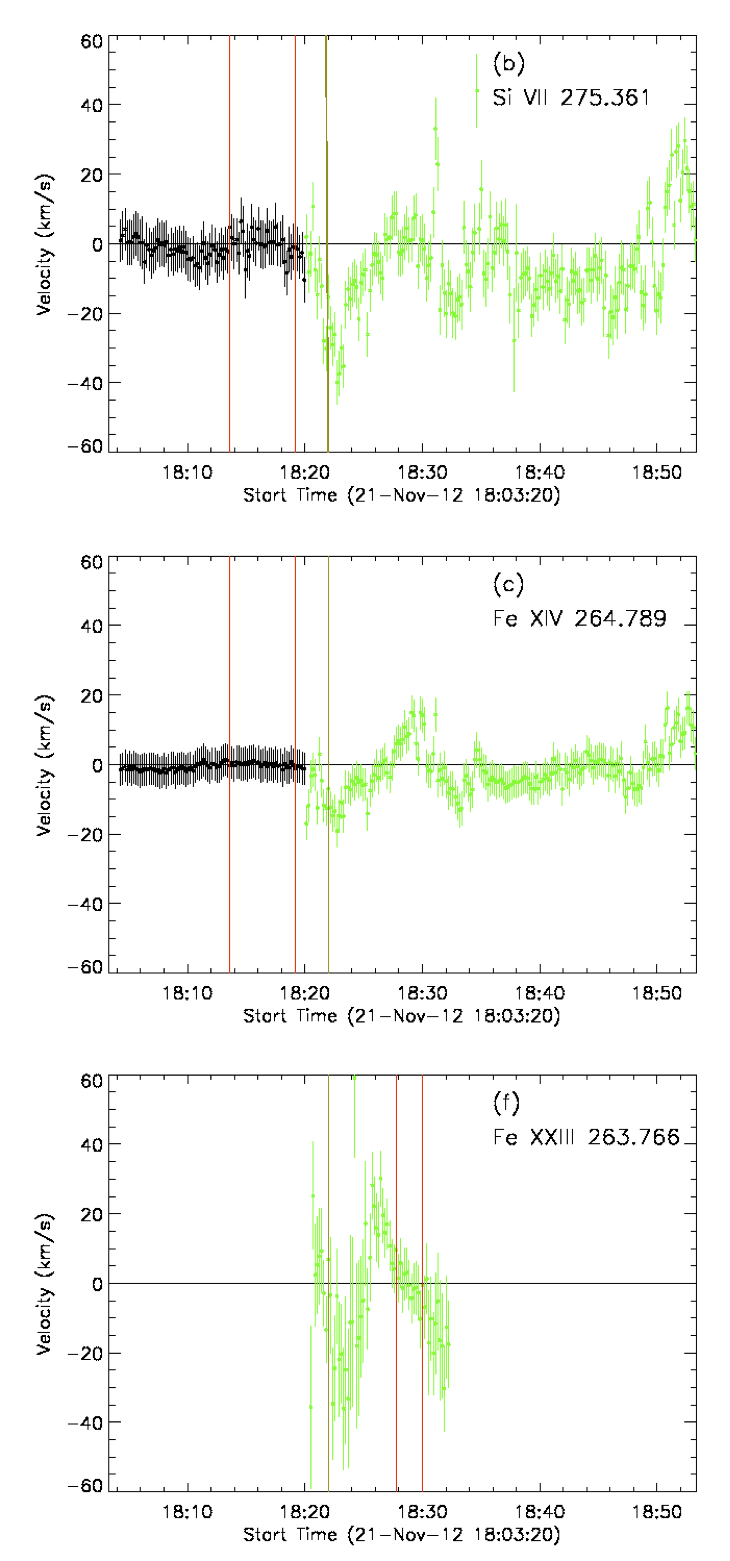
Figure 4: Relative Doppler velocities of Si VII 275.361, Fe XIV
264.789, and Fe XXIII 263.766 A. Black symbols and error bars correspond to
measurements during the pre-flare interval, when we fit only one Gaussian
component to each emission line, and green correspond to times after the flare
start. Solid tan vertical lines indicate the time of the peak intensity for
each line. Except for Fe XXIII, to which we always fit only one component, the
displayed flare velocities (green) are derived from the flare component of the
two-component fits. Solid red vertical lines indicate the time interval from
which each line's reference wavelength was derived.
(4) Electron Densities: We derive the evolution of the electron density in the
flare source (Figure 5) from the intensity ratio of the flare components of the
Fe XIV lines at 264.789 and 274.204 A. We remove the Si VII 274.180
contribution using the theoretical intensity ratio given above. The Si VII
275.361 line intensity (and hence the Si VII 274.180 line intensity) increases
by a factor of 15.7 from its pre-flare average to its impulsive-phase maximum,
much larger than the factors by which Fe XIV 264.789 A (2.9) and 274.204 A (1.9)
increase. For exposures during the impulsive rise of the flare, the Si VII
274.180 A flare component intensity is 22% - 32% that of the Fe XIV 274.204 A
flare component intensity, which underscores the importance of accounting for
this blend when measuring flare densities with Fe XIV 264.789/274.204. The
electron density increased an order of magnitude from its pre-flare quiescent
average of (3.43 +/- 0.19) x10^9 /cm^3 to its maximum impulsive phase value of
(3.04 +/- 0.57) x10^10 in 2 minutes. This pre-flare average density (log n_e =
9.54) is typical for quiescent active regions, and indicates that the corona was
not mass-loaded by earlier flare activity. Thus we have no reason, based on
electron density measurements, to expect suppression of evaporative upflows
(e.g., Emslie et al. 1992).
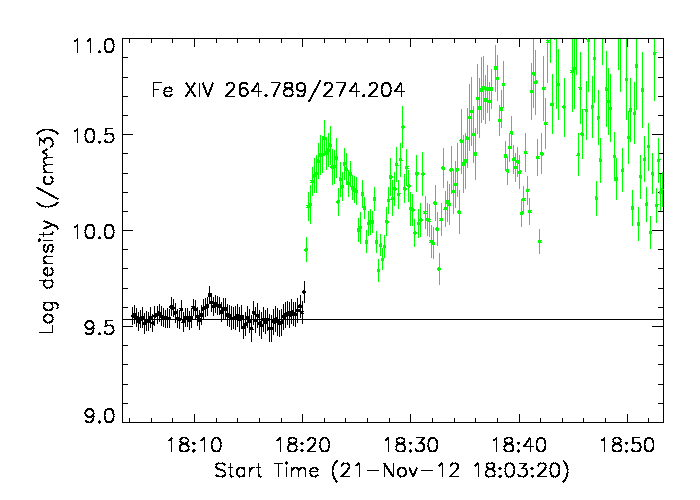
Figure 5: Log of the electron density derived from the Fe XIV
264.789/274.204 intensity ratio. Black symbols and error bars correspond to
times prior to the flare, and green symbols and error bars correspond to times
during the flare. For pre-flare times we use intensities derived from single
component fits to the observed spectral lines, and for later times we use only
the flare components of the two-component fits. The Si VII 274.180 A blend is
removed from Fe XIV 274.204 as described above. The intensities of the flare
components become small and highly uncertain later during the event, eventually
leading to more scatter and larger uncertainties. The solid black horizontal
line indicates the average log density (9.535) in the pre-flare quiescent
reference interval.
Interpretation and Summary
Because the transition region lines brightened significantly (by factors around
16) during their rapid impulsive rise, we know that we observed a site of energy
injection into the chromosphere. Because the transition region lines brightened
before the hot flare (Fe XXIII) emission appeared, we know that the
chromospheric heating was not due to thermal conduction from a flare-heated
coronal source. Because the observed upward velocities were small, uncertain,
and did not begin until after the lines had already brightened, and continued
long after each line's peak intensity, the increase of line intensity was not
due to upward velocities filling coronal loops. The rapid density increase
observed in the Fe XIV emission tracked the Fe XIV intensities, and so also was
not due to upward moving material filling coronal loops; if the increase in
intensity and the increase in density were related to upward velocities, they
both would have continued to increase as long as the velocities were directed
upward, which they did not.
This argues for flare heating in the chromosphere, likely by reconnection. In
this scenario, reconnection drives local heating to flare temperatures (10 MK)
in the chromosphere (initially at temperatures around 0.01 MK). It also drives
reconnection jets, which increase the nonthermal, turbulent velocities of the
various emission lines. The heated plasma cools radiatively and conductively,
the latter of which heats chromospheric plasma to progressively lower
temperatures with increasing distance from the reconnection site. In this way
plasma temperatures from largest to smallest are distributed around and
surrounding the reconnection site, becoming cooler with distance. Bulk motions
at the reconnection site are suppressed by the large plasma density in the
surrounding chromosphere, so that large upward velocities are not observed. The
hottest material (at the actual reconnection site) is buried too deeply to
explode upward. As one gets far enough away from the reconnection site,
however, heated chromospheric material can expand upward into the relatively
tenuous overlying transition region and corona, and evaporation occurs. We see
this in the form of blueshifts in the Mg VI, Si VII, and Fe XIV lines in our
sample, but not in Fe XVI or Fe XXIII.
The Fe XIV density increased rapidly from its ``typical" pre-flare value of 3.43
x 10^9 to a value of 3.04 x 10^10 /cm^3 in the flare component at the earliest
intensity peak; that this increase began before upward velocities were observed
and proceeded independently of those velocities (the velocities continued after
the densities had begun to decline) is consistent with the idea that the Fe XIV
emission was coming from stationary chromospheric material that had just been
heated to Fe XIV temperatures, rather than evaporated material moving upward and
filling flare loops. The density increase may be due to a progression of
reconnection sites to greater depths in the chromosphere, where it had access to
larger densities, or it may be due to compression of 2 MK plasma by the 10 MK
plasma as it attempted to expand against the high density chromospheric plasma.
Additional observational support for the chromospheric reconnection scenario
lies in the fact that neither Fe XIV line showed significant upflows or
downflows around the time of the brightest intensity peak that occurred later,
presumably due to cooling of flare material. The absence of flows at this time
(in any of the lines) indicates that flare plasma was not falling down, but
rather cooling ``in place." This indicates that not only the heating and
brightening, but also the subsequent cooling, all took place locally in the
chromosphere. This scenario needs to be confronted with theoretical model
calculations as well as additional observations.
References
1. Brosius, J. W. 2013a, ApJ, 762, 133
2. Brosius, J. W. 2013b, ApJ, 777, 135
3. Brosius, J. W., & Holman, G. D. 2009, ApJ, 692, 492
4. Dere, K. P., Landi, E., Mason, H. E., Monsignori-Fossi, B. C., & Young, P. R.
1997, A&AS, 125, 149
5. Emslie, A. G., Li, P., & Mariska, J. T. 1992, ApJ, 399, 714
6. Kamio, S., Fredvik, T., & Young, P. 2011, EIS Software Note 5
7. Kamio, S., Hara, H., Watanabe, T., Fredvik, T. & Hansteen, V. H. 2010, SoPh,
266, 209
8. Landi, E., Del Zanna, G., Young, P. R., Dere, K. P., & Mason, H. E. 2012,
ApJS, 744, 99
9. Young, P. R. 2011, EIS Software Note 7
10.
Young, P. R., et al. 2007, PASJ, 59, S857
Next EIS Nugget »» coming later...
TBC
Last Revised: 26-Sep-2013
Feedback and comments: webmaster
|


