While X-ray and EUV imagers take images at a cadence close to the
characteristic evolutionary timescales of solar phenomena, narrow slit
spectroscopy is better suited for many plasma diagnostics. This improvement in
our ability to measure the properties of solar plasmas, however, is often
achieved at the expense of longer exposure times and a slower cadence. Wide
slit spectroscopy ("overlapograms") is a compromise between both worlds as
it produces images of over a relatively large field-of-view in bands as
narrow as a single spectral line.
The EUV Imaging Spectrometer (EIS) has a 40" wide slit that can take 40"x512" images at a 0.9 Å spectral
resolution. Solar spectral lines are about 0.3 Å wide so that a wide slit (slot) image of an isolated emission line is monochromatic.
Completely isolated lines in the EUV spectrum are rare, but there are a few lines that are sufficiently dominant
contributors to their spectral range as to consider them isolated in practical terms. Some of these
lines are:
Si VII 275.37 Å (T=0.6 MK),
Fe XI 180.40 Å,
Fe XII 195.12 Å (T=1.3 MK),
Fe XIII 202.04
Å (T=1.6 MK),
Fe XV 184.16 Å (T=2 MK),
Fe XVI 262.98 Å (T=2.5 MK).
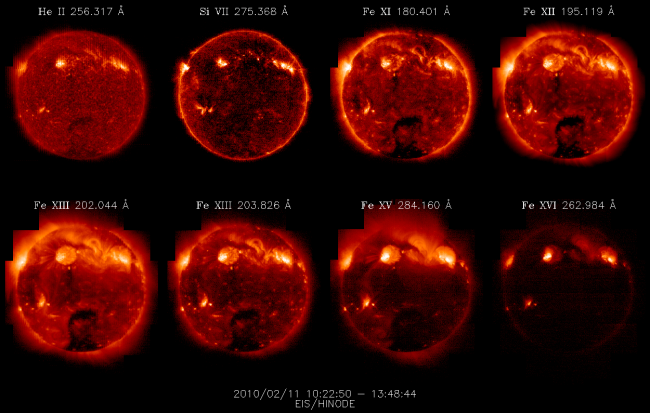
Figure 1: EIS full Sun mosaic from February 2, 2010. (Click figure to see full-size image)
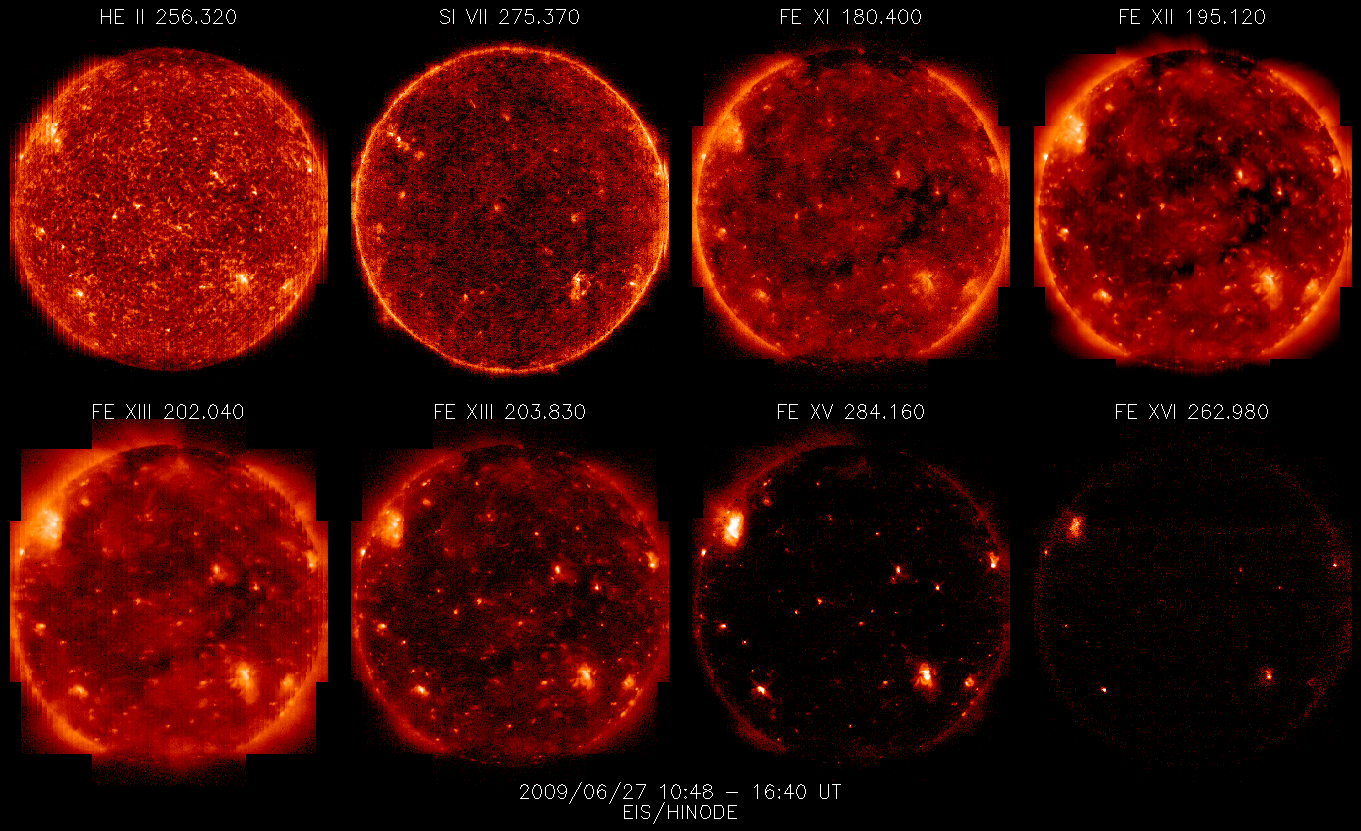
By executing scans at a number of positions on the Sun, EIS is able to build up images of the entire solar disk.
The first dataset of this kind was taken
June 27, 2009.
Clean monochromatic images of the full disk were taken in nine spectral lines,
spanning a range of temperatures from 0.05 to 2.5 MK. These full disk mosaics were developed in anticipation
of NASA's Solar Dynamic Observatory (SDO) mission. Since then these full disk mosaics have been performed about
every three weeks as part of the
Hinode Operational Plan:
HOP130.
The main objectives of the HOP are two-fold: monitoring the EIS calibration in direct comparison with EVE on SDO
and monitoring the solar cycle dependent EUV radiance at multiple temperatures.
EVE,
the Extreme-ultraviolet Variability Experiment, measures the EUV irradiance in the 1-1050 Å range at
~1 Å resolution. The spectral overlap makes it an ideal benchmark to monitor the EIS calibration over
time. So far, only a few datapoints are available, but the preliminary comparison suggests that the calibration
of both instruments agrees within 20% for several strong and isolated lines:
Fe XI 180.40 Å,
Fe XII 195.12 Å,
Fe XVI 262.98 Å.
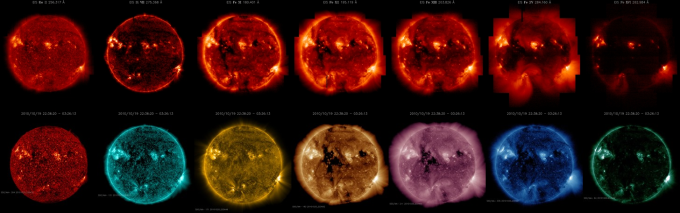
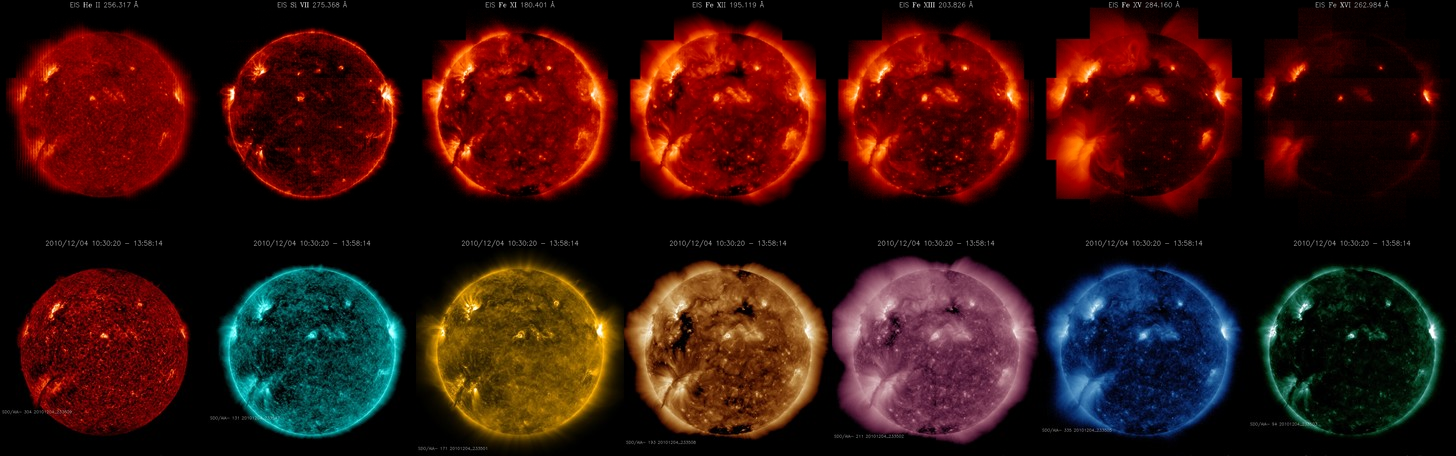
Figure 2: The Sun as seen by EIS/Hinode and AIA/SDO on December 04, 2010.
Top row: EIS full Sun mosaics (He II 256.3 Å,
Si VII 275.37 Å, Fe XI 180.40 Å, Fe XII
195.12 Å, Fe XIII 202.04 Å, Fe XIII 203.8 Å,
Fe XV 184.16 Å, Fe XVI 262.98 Å);
Bottom row: AIA/SDO images (304 Å, 131 Å, 171 Å, 193 Å, 211 Å, 335 Å, 94 Å). (Click figure to see full-size image)
Imagers like AIA/SDO, EUVI/STEREO, EIT/SOHO already take full Sun images in a fairly narrow spectral window at
a much faster cadence. Do then these EIS observations have anything unique that makes them a good complement to that
suite of state-of-the-art imaging instruments? Yes, the spectral purity, which gives EIS a greater range of plasma
diagnostics. In addition to the intensities, which can be used to derive emission measures and temperatures,
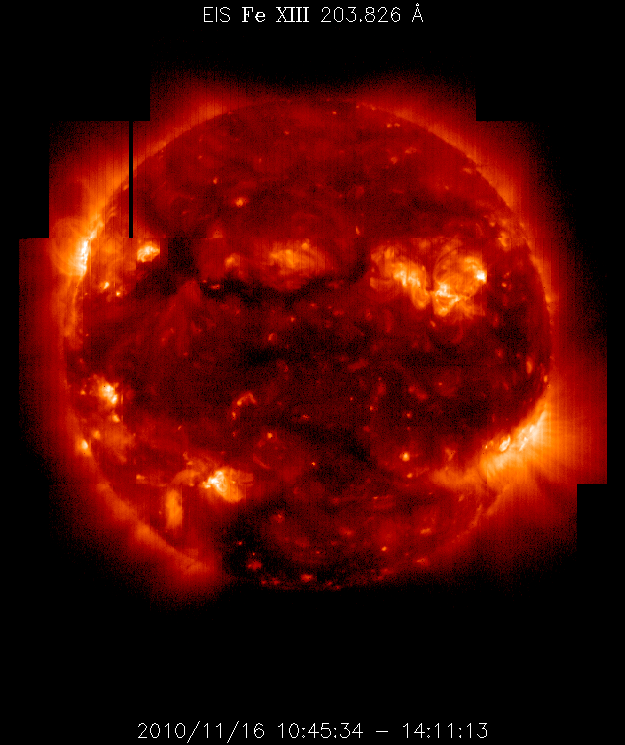
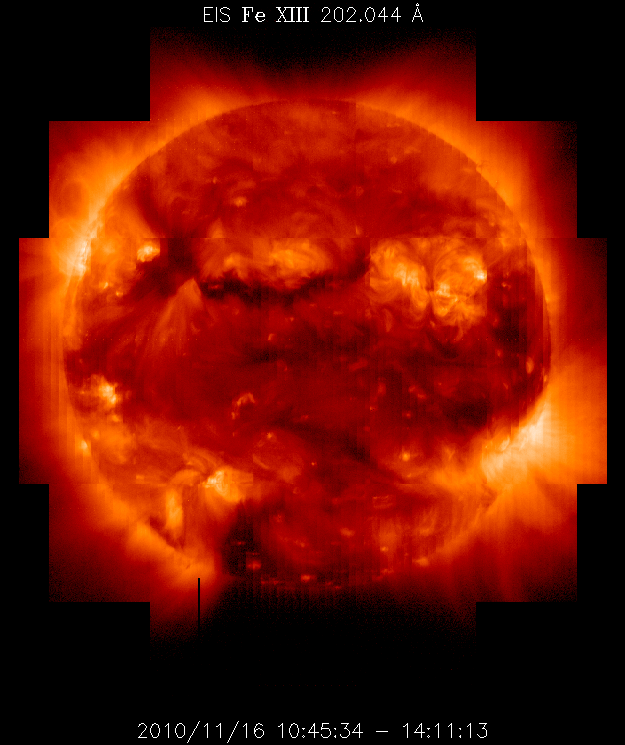
the ratio of
Fe XIII 203.8 Å to
Fe XIII 202.04 Å
can be used to derive electron densities from the wide slit data. The first line is blended with a
Fe XII line, but for typical densities (log N ~ 9.0 - 10.0) the contribution of the
blend is less than 10% in active region and 15% in the quiet Sun (Ugarte-Urra & Warren 2011).
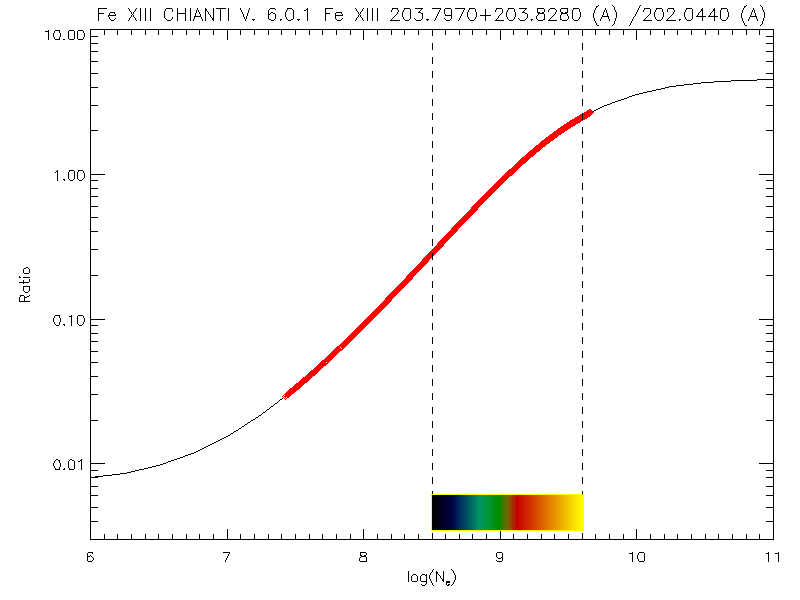
From the ratio map and the density dependence of the ratio, calculated with
CHIANTI,
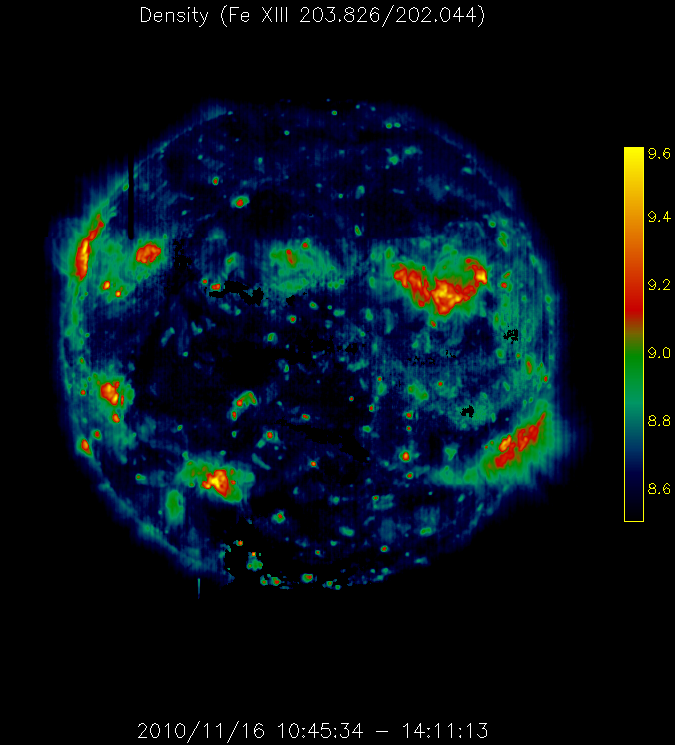
we can produce a map of the density in the upper solar atmosphere. To the best of our knowledge these are
the first full Sun density maps produced. The map below shows at once several well known features: high densities at the core of
active regions, low densities at the poles and small density concentrations spread rather uniformly across
the disc, coronal bright points.
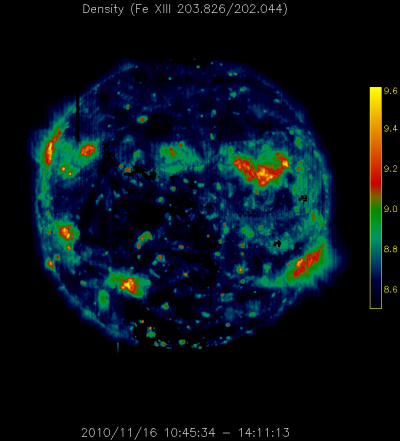
Figure 4: Full Sun map of the electron density. Log scale. (Click on images see full-size)
This analysis is not restricted to full Sun images. In a recent paper, Ugarte-Urra & Warren (2011) show examples
of the emission measure and density analysis on loops and jets as function of time. The Doppler information is
mostly lost in the wide slit data due to the overlap of spatial and spectral information on
the detector, however, it is possible to retrieve it under certain conditions
(Innes et al. 2008) or assumptions (Sun et al., in preparation).
References:
Innes et al., SoPh 252, 283 (2008)
Ugarte-Urra & Warren (2011), Submitted to ApJ.


