For large eruptions on the Sun, it is often a problem that the core dimming
region cannot be observed due to the bright emission from the flare itself.
However, spectroscopic data can provide the missing information through the
measurement of Doppler velocities. We analysed the well-studied flare and
coronal mass ejection that erupted on the Sun on 13 December 2006 and reached
the Earth on 14 December 2006. In this example, although the imaging data were
saturated at the flare site itself, we could extract information on the core
dimming region through velocity measurements, as well as on the remote dimming
sites ( see
Figure 1 ).

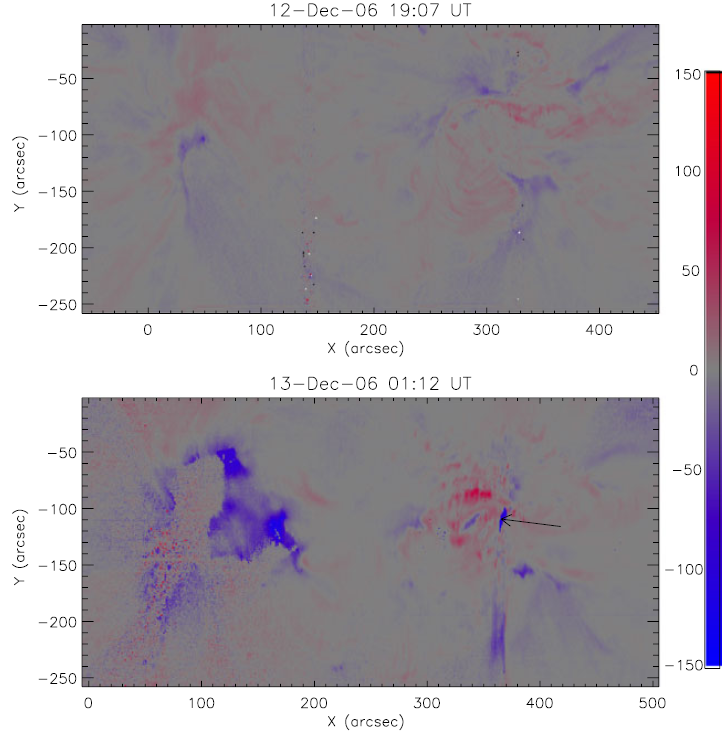
Figure 1:
Doppler velocity map of the active region (on the right hand side) and the plage region (on the left hand side).
The top image shows the Doppler velocities before the flare and coronal mass ejection. The bottom figure shows
the Doppler velocity image during the flare and coronal mass ejection. The black arrow highlights the region of
strong outflow related to a filament eruption. (Click the figure to see full-size image)
The purpose of this work was to determine more accurately the magnetic flux of
the solar source region, potentially involved in the ejection, through a new technique.
The results of its application are compared to the flux in the magnetic cloud observed
at 1AU, as a way to check the reliability of this technique. We analysed data from the
Hinode EUV Imaging Spectrometer to estimate the Doppler velocity in the active region
and its surroundings before and after the event. This allowed us to determine a Doppler
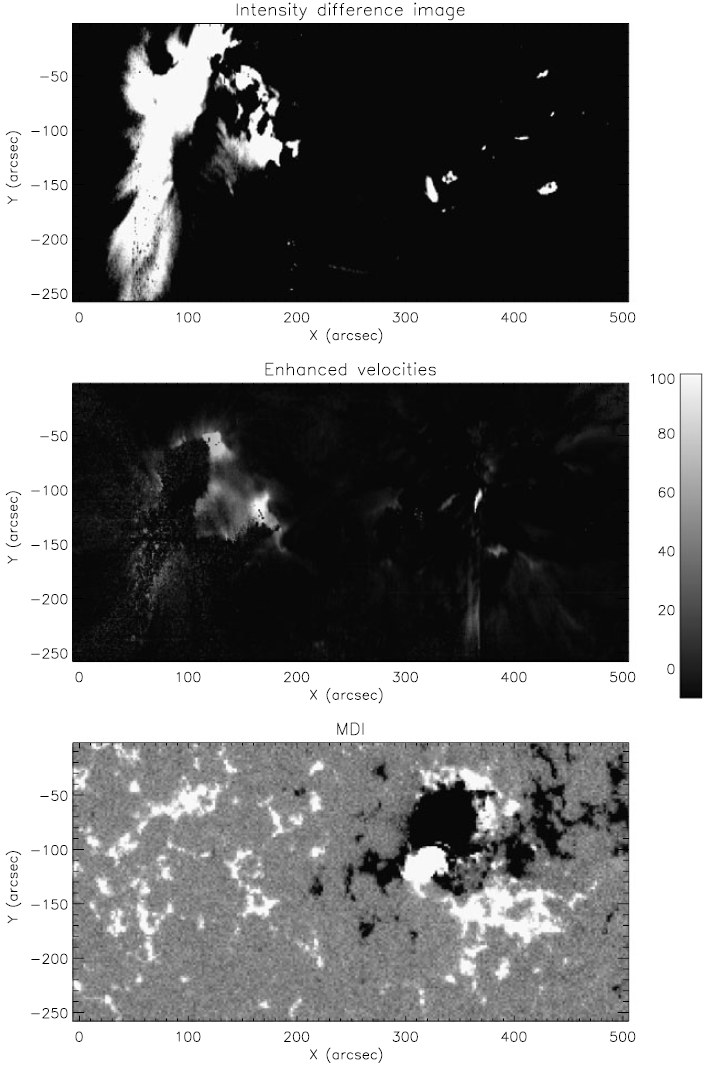
velocity 'difference' image. We used the velocity difference image overlayed on a
Michelson Doppler Imager magnetogram to identify the regions in which the blue-shifts
were more prominent after the event ( see
Figure 2 ). The magnetic flux in these regions
was used as a proxy for the ejected flux and compared to the magnetic cloud flux. We
found that the if we took a lower limit of the velocity difference of 20 km/s, there was
agreement between the magnetic flux at the Sun, and that determined from the magnetic cloud.

Figure 2:
The top figure shows the intensity difference image. The middle figure shows the velocity dfference image and
the lower figure shows the magnetogram from MDI. (Click the figure to see full-size image)
This new method provides a more accurate flux determination in the solar source region.
In the future we need to understand what limit in velocity difference is physically the
best one to use - any ideas anyone??
Reference:
This paper has been published in Solar Physics, 2011, 268, 213-230 by Harra, Mandrini, Dasso, Gulisano, Steed and Imada.
The link: http://www.springerlink.com/content/r013p422v7l10utg/