The Hinode and STEREO satellites are now revealing, in unprecedented detail, one of the phenomena hidden from our view since the
loss of the Yohkoh satellite: EUV/X-ray jets or jet-like events from coronal bright points. In this nugget we discuss the very
rare circumstance of a jet-like event which was simultaneously observed by two spectrometers and several imagers. It was
co-registered with the EUV Imaging Spectrometer (EIS) and the X-ray Telescope (XRT) onboard Hinode, the Solar Ultraviolet
Measurements of Emitted Radiation (SUMER) spectrometer onboard SoHO and the EUV Imagers (EUVI) onboard the twin STEREO satellites.
The spectrometers took observations in spectral lines with formation temperatures from 10,000 K to 12 MK. The alignment of all
instruments is described in
Madjarska (2011).

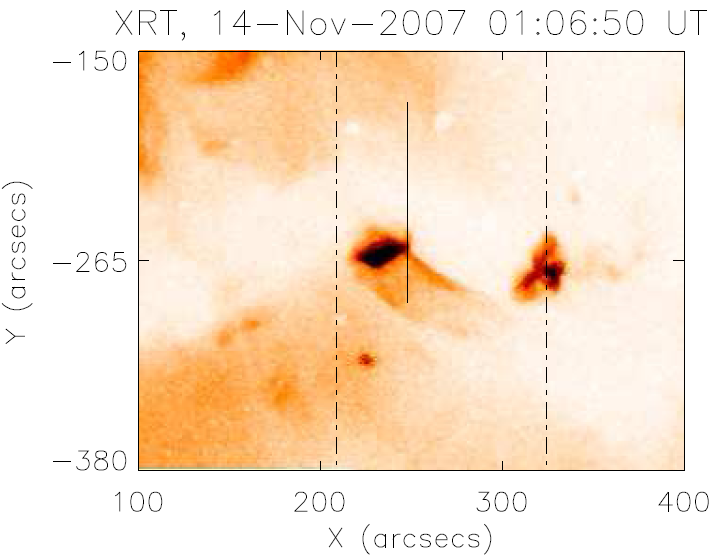
Figure 1: Al_poly XRT image (reversed colour table) of the jet-like feature studied here. The vertical continuous line corresponds to the position of the SUMER slit. The dash-dotted line denotes the horizontal and part of the vertical field-of-view of the EIS raster.
(Click figure to see full-size image)
X-ray jets in the solar atmosphere were first seen in images from the Soft X-ray Telescope onboard the Yohkoh satellite. They
appear as collimated flows originating from coronal bright points (BPs) or active regions and are always triggered by so-called
micro-flares which appear as small-scale transient brightenings. They are always associated with pre-existing open magnetic
fields and were found, therefore, to occur predominantly along coronal hole boundaries (polar, equatorial or transient) or
inside coronal holes (
Subramanian et al. 2010). It is believed that the majority of the jet-like phenomena in the solar
atmosphere are produced by magnetic reconnection.
The event discussed here occurred at the boundary of an equatorial hole on 2007 November 14 (
Figure 1). It started after an energy
deposition, in the form of a micro-flare, occurred in the BP. After producing a sequence of difference images by subtracting from
each image the preceding one (
Figure 2), we were surprised to discover that the energy deposition occurred several times during the
event and in different locations in the bright point.
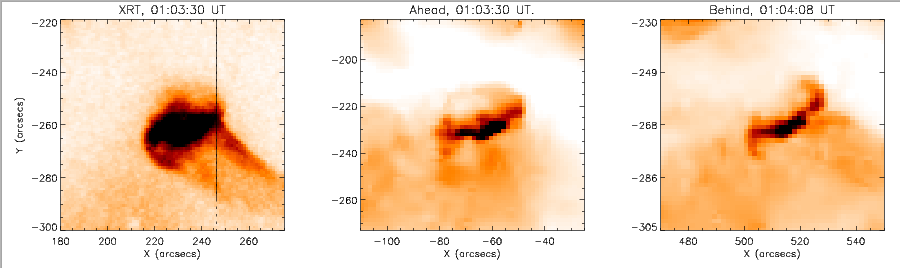
Co-temporal XRT, EUVI Ahead and Behind images clearly show that following the first energy deposition the BP loops started to expand until some of them became "quasi" open. The main plasma flow is seen to escape along the extended legs of the BP loops (see the included
movie).
Movie 1: Movie showing XRT and STEREO EUVI images of the plasma flow along the extended legs of the BP loops following a micro-flare.
(Click to see larger version)
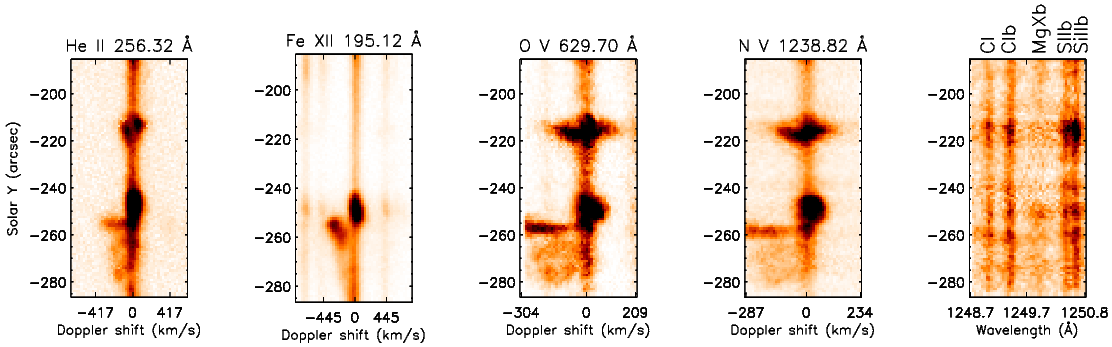
The plasma flow is best seen in the spectroscopic observations where the slits of the two spectrometers cross the expanding loops (
Figure 3). By comparing the emission in the He II 256 Å and Fe XII 195 Å lines we found that first the taller and hotter loops were expelled followed by the lower and cooler ones. The Doppler shifts of the ejected plasma reached 350 km/s, although some emission is seen as fast as 450 km/s. From the spectroscopic observations we established two main flows: a very fast outflow, which was regenerated after each energy deposition and a down-flow guided along curved (most probably closed) magnetic field lines (best seen in EUVI B).
After comparing this observation with the animation sequence, we can consider two possible scenarios. One is that the hotter and taller loops of the BP started to expand first and were then followed by the lower lying cooler loops 2 minutes later. The other scenario is that the plasma from the energy deposition site is the first plasma propelled along the newly reconnected open magnetic field lines. The second scenario is consistent with the observation that a strong plasma outflow was registered along the straight magnetic field lines situated in the north-west side of the jet-like event as seen in projection on the disk. There is also the possibility that these elongated structures represent the legs of the loop(s) that became quasi-open.
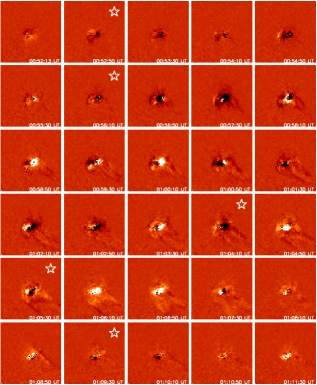
Figure 2: Al_poly XRT image (reversed colour table) of the jet-like feature studied here. The vertical continuous line corresponds to the position of the SUMER slit. The dash-dotted line denotes the horizontal and part of the vertical field-of-view of the EIS raster.
(Click figure to see full-size image)
From the spectroscopic observations we determined a temperature of 12 MK (Fe XXIII) in the energy deposition site while the density derived in the same location from the Fe XII 186.88/195.12 Å line ratio was 4 x 10
10 cm
-3. Surprisingly, when both spectrometers were observing the same position, very weak emission was found in the SUMER Mg X 624.9 Å line while at the same time all spectral lines from Fe XII to Fe XV in EIS had a large increase in emission. However, the increase in the Mg X line could be due to a blend by chromospheric lines rather than Mg X itself. That raises concerns about the uncertainty in using the SUMER Mg X 624.9 Å line for coronal diagnostics as it has been done during the SoHO era.
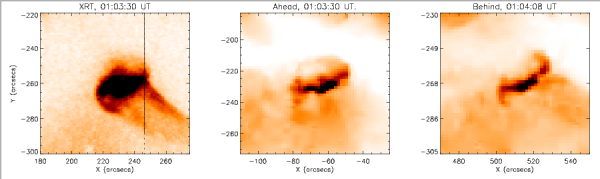
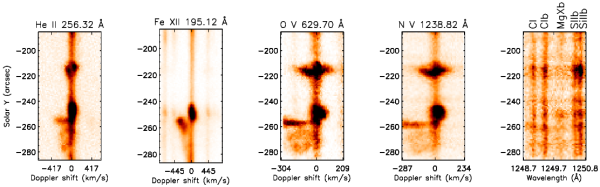
Figure 3: Top: XRT image over-plotted with the SUMER slit position and EUVI A and B images during the jet-like phenomenon.
Bottom (from left to right): EIS He II 256.32 Å and Fe XII 195.12 Å spectra along the EIS slit at 01:02:44 UT; SUMER O V and N V spectra along the SUMER slit; and a spectral window comprising C I 1248.0 Å, C I 1249.0 Å, Mg X 624.9 Å taken in second order, Si II 1250.41 Å and S II 1250.58 Å at 01:02:019UT (for details on blends and formation temperatures please see Madjarska (2011)).
(Click figure to see full-size image)
References:
Madjarska, 2011, A&A, 526, 19
Subramnian, S., Madjarska, M.S. & Doyle, J.G., 2010, A&A, 516, 50