I just wanted to alert people to the fact that we've written a wrapper to the EIS objects that return the data as a structure. This may provide somewhat faster access to the data. Here's a quick example. If you wanted to read the Fe XII 195 data window from a file and plot it you could do this:
IDL> d=eis_getwindata('eis_l0_20070202_104212')
% EIS_GETWINDATA: no window number input, select one . . .
iwin line_id wvl_min wvl_max
0 FE X 174.530 174.36 174.70
1 FE X 175.260 175.10 175.43
2 O VI 184.120 183.95 184.29
3 FE X 184.540 184.38 184.71
4 FE VIII 185.210 185.05 185.38
5 FE XII 186.880 186.72 187.05
6 FE XI 188.230 188.06 188.39
7 CA XVII 192.820 192.65 192.98
8 FE XII 193.510 193.34 193.67
9 FE XII 195.120 194.94 195.28
10 FE XIII 202.040 201.87 202.21
11 FE XIII 203.830 203.65 203.99
12 HE II 256.320 256.15 256.49
13 FE XVI 262.980 262.83 263.17
14 FE XIV 264.780 264.63 264.97
15 MG VI 268.990 268.84 269.17
16 FE XIV 274.200 274.05 274.38
17 SI VII 275.350 275.20 275.54
18 O IV 279.930 279.78 280.12
19 FE XV 284.160 284.01 284.34
Select a window to read [0...19]> 9
IDL> help,/str,d
** Structure <2974204>, 19 tags, length=8397328, data length=8397322, refs=1:
FILENAME STRING 'eis_l0_20070202_104212.fits.gz'
LINE_ID STRING 'FE XII 195.120'
INT FLOAT Array[16, 256, 256]
ERR FLOAT Array[16, 256, 256]
WVL DOUBLE Array[16]
TIME FLOAT Array[256]
TIME_CCSDS STRING Array[256]
EXPOSURE_TIME FLOAT Array[256]
SOLAR_X FLOAT Array[256]
SOLAR_Y FLOAT Array[256]
NL LONG 16
NX LONG 256
NY LONG 256
SCALE FLOAT Array[2]
UNITS STRING 'DN'
MISSING INT -100
IWIN LONG 9
HDR STRUCT -> <Anonymous> Array[1]
TIME_STAMP STRING 'Fri Jul 6 08:44:52 2007'
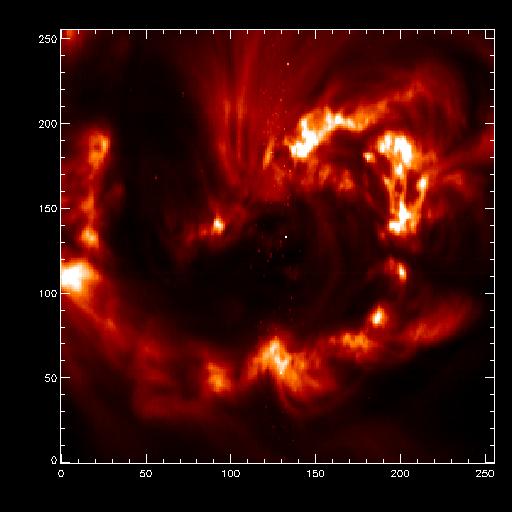
IDL> plot_image,sigrange(total(d.int,1))
The resulting image is below. The routine also works on level1 data processed with eis_prep. More information is available in the header.
 |
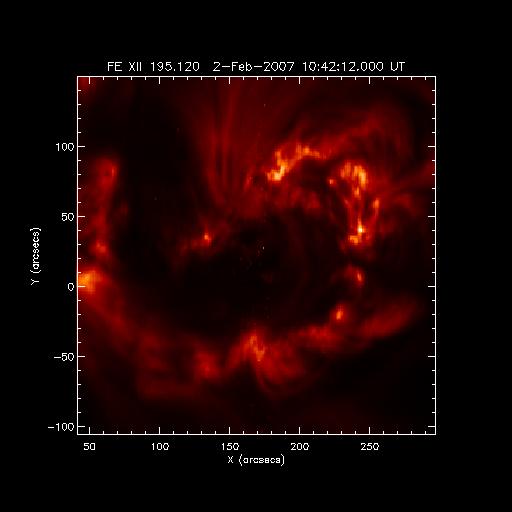
I have done a small program "plot_eis_raster.pro " where you can visualize the structure with the coordinates, time and name of the window.
plot_eis_raster.pro is just valid for the slit rasters (I haven't tried with any slot).
A few comments: the time that it shows is the time of the beginning of the raster; and the coordinates is calculated using the mean value of d.solar_x and using the size of the slit per each pixel. To use it you just have to (for the same example than before):
IDL> plot_eis_raster,d
 |
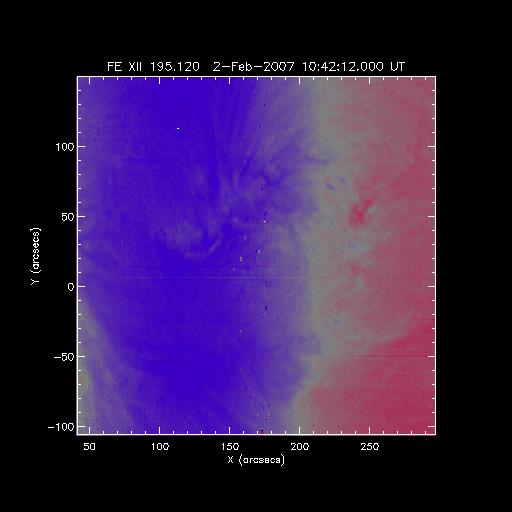
Or if you want to change the value to plot (e.g. the values that you obtain after fit the line)
To plot the array called velocity (in my case velocity=reform(result(1,*,*)) ):
IDL> plot_eis_raster,d,value=velocity
 |
Also you can use all the keywords of plot_map (dmin, dmax, etc.)
And you can save the map produced,
IDL> plot_eis_raster,d,value=velocity,map=velocitymap
-David Pérez-Suárez, 06 Jul 2026