New flux emergence into a pre-existing active region clearly can have
dramatic consequences, often producing flaring with hours of the flux
appearing. The high resolution of the SOT data also shows the complexity
of the flux as it emerges with the complex and small-scale positive/
negative (white/black) features appearing. These small-scale structures
are thought to be indicative of a serpentine structure emerging into the
atmosphere (e.g. Cheung et al., 2008). There have been evidence of
small-scale brightenings corresponding to these complex structures in
the chromosphere. In this nugget we look at the response of the
emerging flux in the active region observed in 1-2 December 2006. This
active region was studied by Magara (2008), and shows a beautiful
example of flux emergence (see
Figure 1 and movie 1:
eis_sot.avi).

Figure 1:
The left hand side show the SOT Fe I Stokes-V data showing the
evolution of the emergence of flux into the lagging polarity of a preexisting
active region. The right hand side shows the TRACE 171 data at
the same times with the SIT contours overlaid. » Click figure to see full-size image.
We found little evidence of small scale structures corresponding to
complexity of the serpentine field, suggesting that by the time the
magnetic field reaches the corona it has become a large-scale structure
(see for example Strous and Zwaan, 1999). However the larger scale
response to the flows in the corona are quite dramatic. Movie 2 shows the
TRACE 171 fluctuations with time. As the flux emerges reconnection
takes place on one side of the emerging flux, and eventually large scale
loops form overlying the whole region. If we look at the Doppler flows in
EIS, we can see a gradual enhancement of the outflows at the edges of
active regions. These outflows are a potential source of the slow solar
wind, and their source is currently under debate with waves,
compression, large scale reconnection and small angle reconnection all
being possibilities. As the flux emerges a strong enhancement in the
Doppler flows are seen to the left-hand side of the emergence (see
Figure
2). This is the region where the new positive polarity emerges into preexisting
positive polarity. Whatever the process is appears to create
stronger outflows, which should help us understand whether this can
form part of the solar wind. We are currently comparing the data with
simulations and hope to understand the process in more detail soon —
watch this space!!

Figure 2:
This is the evolution of the Doppler velocity of the Fe XII ion
during the flux emergence. The velocities range between ± 30 km/s.
Red shows downflow and blue shows upflow. » Click figure to see full-size image.
The first movie (
eit_sot.avi) shows the EIS Fe XII intensity data overlaid on
the SOT magnetic field data. This give an idea how the intensity of the
corona changes as the flux emerges into the lagging polarity of the active
region.
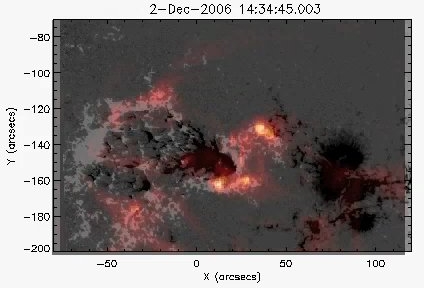
Figure 3:
Screenshot of the movie "eit_sot.avi" » Click figure to download the movie.
The second movie shows the TRACE data as the flux emergence proceeds
(
trace_int.mov). The region to the right of the new flux emergence shows
evidence of reconnection occurring with many new small loops being
created. The region to the left of the flux emergence doesn't show such
clear reconnection as it is dominantly the same polarity interacting.
This text will be replaced
Movie 2 »
Click here to download the original movie (in MOV format, 11MB)


