Measurement of outflow velocities in on-disk plumes from EIS/Hinode observations
Hui Fu, Lidong Xia, Bo Li, Zhenghua Huang, Fangran Jiao and Chaozhou Mou (Shandong University, China)

Solar plumes are ray-like bright structures and can be observed in both visible light and EUV (Wilhelm et al. 2011, and references therein). Plumes are found to be rooted mainly at mid- and high latitudes where the global magnetic fields open into interplanetary space. Since plumes are mainly found in coronal holes (CHs), their relationship with the solar wind became a significant issue. To evaluate the contribution of plumes to the solar wind, an important prerequisite is to get the outflow velocity in plumes.
The Doppler Dimming technique (Rompolt 1967) is often used to derive the outflow velocity of off-limb plumes. But this method strongly depends on empirical assumptions of electron density and ion temperature, leading to different results with different assumptions (Wilhelm et al. 2011). Measuring the Doppler shift on the disk, Hassler et al. (1999) and Wilhelm et al. (2000) found that the base of the plumes does not show a clear blueshift compared to other CH regions.
In this study, we use spectroscopic observations with the EUV Imaging Spectrometer (EIS; Culhane et al. 2007), which includes many coronal lines and covers a wide temperature range. It gives us an opportunity to study the Doppler velocities in the extended structure of plumes on the disk.
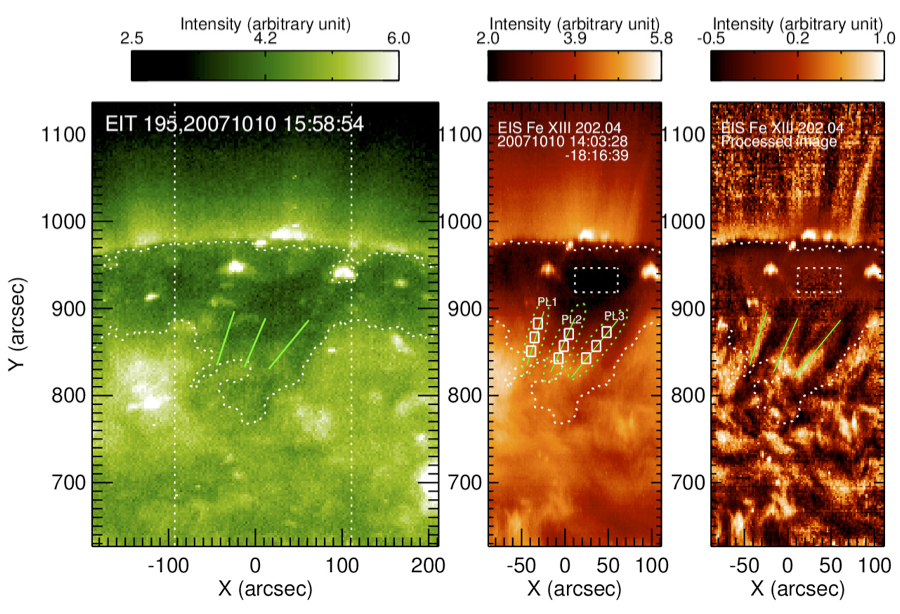
Figure 1: Images of the north polar CH observed on 2007 Oct 10. The left panel shows the EIT 195 image with EIS field of view overplotted (vertical dotted lines). The middle panel shows the intensity map recorded by EIS in Fe XIII 202.04, and the right panel shows the processed image of intensity map of EIS. The white contours outline the boundary of the CH, and the small region marked by the dotted line rectangle represents the typical dark region of the CH. The three tilted green full lines represent the center of the plume structures which are better seen in the processed image (right panel), and the three full line rectangles in each plume represent the plume structure from bottom to top.
In Figure 1, we show the intensity map (middle panel) derived from the EIS raster scan in Fe XIII 202.04 on 2007 October 10, together with the corresponding EIT 195 image (left panel) with a large FOV and processed image of the intensity map using the MGN method (Morgan & Druckmuller 2014). Three plumes outlined by the green solid lines (labeled PL1, PL2, and PL3) have clearly extended structures in the EIS FOV by an inspection of the corresponding processed image. The intensity and Dopplergram maps derived from the Fe VIII, Si VII, Fe X, Fe XII, and Fe XIII lines are displayed in Figure 2. Figure 2 brings to our attention that the strong blueshift patches derived from hot lines Fe X, Fe XII, and Fe XIII coincide with the extended structures of the identified plumes. In contrast, there are smaller blueshifts in the dark region of the CH. So, we can draw an important conclusion that the Doppler shift in the region where plume structures project on the CH reflects the outflow in plume structures.
Furthermore, we provide an outflow velocity profile along the plumes, finding that the velocity corrected for the line-of-sight effect can reach 10 km s-1 at 1.02 Rsun, 15 km s-1 at 1.03 Rsun, 25 km s-1 at 1.05 Rsun.
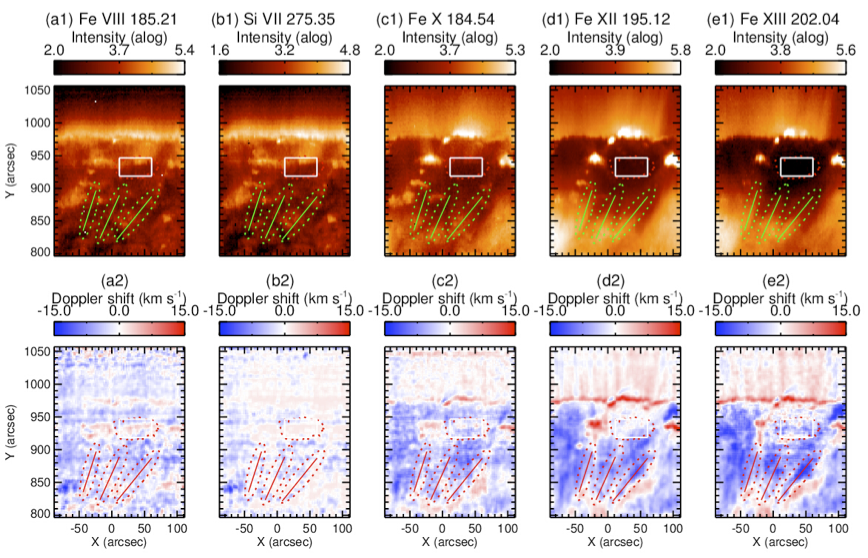
Figure 2: The intensity map and Dopplergram as recorded in the Fe VIII 185.21, Si VII 275.35, Fe X 184.54, Fe XII 195.12 and Fe XIII 202.04 lines on 2007 Oct 10. The plume structures are clear in Fe XII 195.12 and Fe XIII 202.04, and coincide with strong blue-shift patches derived from these two lines.
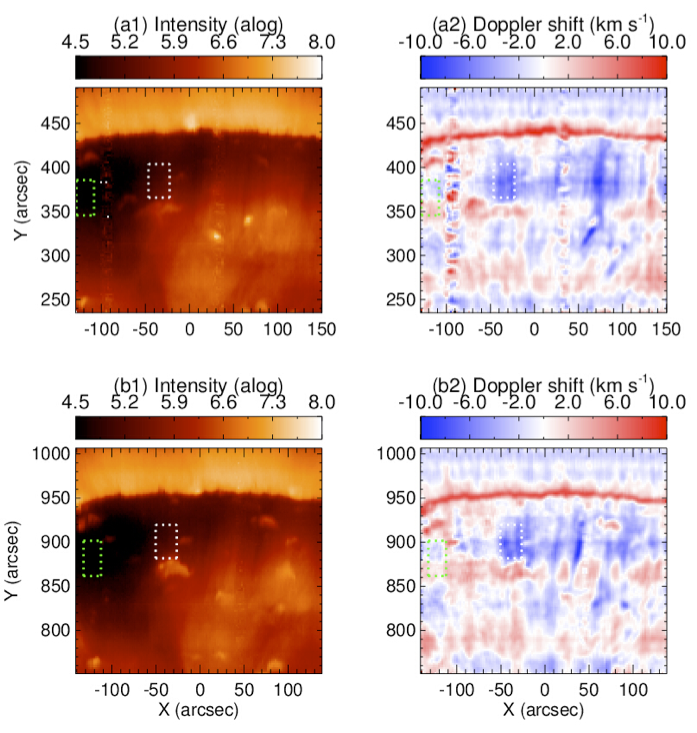
Figure 3: The intensity map and Dopplergram as recorded in the Fe XII 195.12 line on 2010 Sep 04. The top panel was observed from 18:30 to 22:02 and the bottom panel was observed from 22:04 to 01:36 the following day. The selected plume is marked by the white rectangle and the green one represents the CH region.
A question may arise as to whether these blueshift patches are quasi-steady outflows or velocity patterns associated with transient events. To address this question, we follow a plume imaged four hours apart on 2010 September 4, as shown in Figure 3. The top panels show the intensity and Dopplergram observed from 18:30 to 22:02, and the bottom panels are for the measurements between 22:04 and 01:36 the following day. From Figure 3, the shape of the plume does not change substantially in the two scans. Now the question is whether the plumes may have pulsed twice. We then examined the AIA movie for the corresponding time interval and found that indeed the plume persisted for more than seven hours during these two EIS scans. From this, we conclude that the blueshift patches reflect a quasi-steady outflow pattern in the plume structure itself rather than being associated with big transient jets.
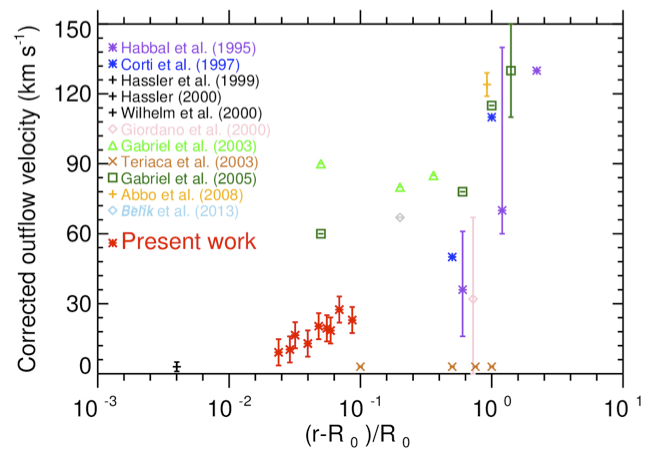
Figure 4: The outflow speeds in plumes at different altitudes gathered from the literature. The results of the present work are shown by the red asterisks.
Finally, we present the outflow velocity as a function of altitude measured by different authors and insert our results, shown as red asterisks in Figure 4. This may provide further information on the velocity of the plume plasma from the solar surface out to 1.4 Rsun, which should serve as an important constraint on plume models. At the height of 1.03 Rsun, EIS also deduced a density of 1.3x108 cm-3, resulting in a proton flux ~4.2x109 cm-2 s-1, which is an order-of-magnitude higher than necessary for the proton input to a typical solar wind if a radial expansion is assumed. This suggests that plumes may be an important source of the solar wind.
References
Culhane, J.L., Harra, L. K., James, A. M., et al. 2007, SoPh, 243, 19
Hassler, D. M., Dammasch, I. E., Lemaire, P., et al. 1999, Sci, 283, 810
Morgan, H., & Druckmuller, M. 2014, SoPh, 289, 2945
Rompolt, B., 1967, AcA, 17, 329
Wilhelm, K., Abbo, L., Auchere, F., et al. 2011, A&AR, 19, 35
Wilhelm, K., Dammasch, I. E., Marsch, E., et al. 2000, A&A, 353, 749
Next EIS Nugget »» coming later...
TBC
Last Revised: 01-Oct-2014
Feedback and comments: webmaster
|


