Emission measure distribution for diffuse regions in solar active regions
Srividya Subramanian

Our knowledge of the dffuse emission that encompasses solar active regions
is very limited. Diffuse emission regions can be defined as regions with no
resolvable structures. The emission from confined loop structures is just about
20-30% higher than the background/foreground diffuse emission. The main aim
of this paper is to study and probe the heating mechanism in the diffuse part
of active regions using emission measure (EM) diagnostics.
Observations
In this study, Hinode/EIS spectral observations of two off-limb active regions,
namely AR10939 and AR10961, obtained on 2007 Jan 26 and 2007 July 08,
respectively, were used. An EM technique were employed. Disentangling the
diffuse emission regions from the rest of an active region is a non-trivial task. The diffuse regions were constrained to be well outside the core structures by tracking the AR core from the center of the Sun to the limb, at Fe XV temperatures.
EM diagnostics of diffuse emission regions
A sample of topologically different areas within the active regions were chosen
and they were divided into different sets. They were designated as set1, 2 & 3 to isolate, respectively, the diffuse emission regions, the boundary between the diffuse regions and the core, and the core. Fig. 1 (top panel) displays the intensity images for one of the active regions (AR 10939 ) obtained in Si VII 275.350 A
(left), Fe XIII 202.040 A (middle) and Fe XV 284.163 A (right) lines. Fe XV
intensity image is over-plotted with 11 masked regions (m1, m2, ..., m11) that
were chosen for EM diagnostics. Unrevised EM distributions (EMDs) were ob-
tained for each of the masked regions using the Pottasch method. We also
applied the revised radiometric calibration (Del Zanna et. al., 2013) on the
derived intensities to obtain the revised EMDs and compared with the EMDs
obtained using the unrevised intensities. Fig. 1 shows the unrevised (row 2)
and the revised (row 3) EMDs for set1, set2 and set3 in the left, middle and
right panels, respectively.
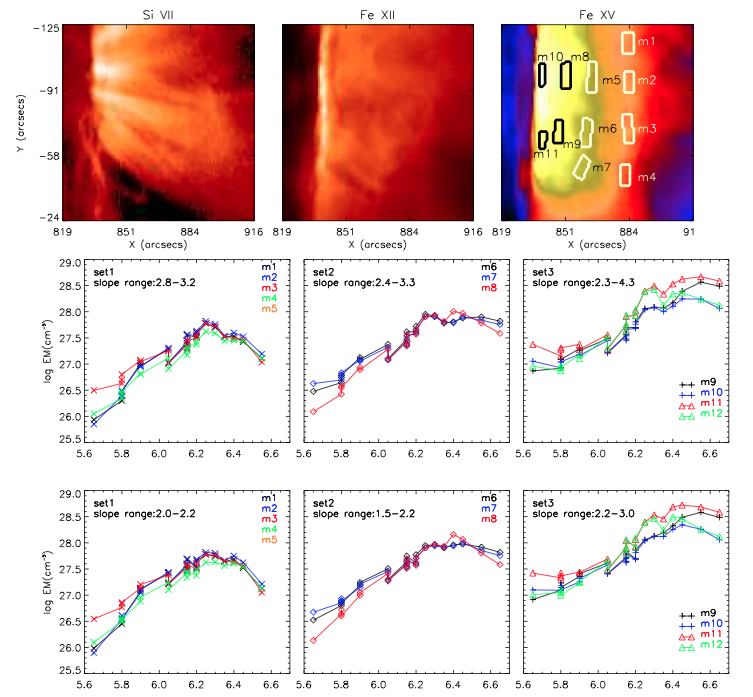
Figure 1: Top (row 1): Intensity image of AR 10939 in Si VII (left), Fe XIII
(middle) and Fe XV (right) with white boxes (m1, m2, ..., m11) representing
the 11 masked regions choosen for DEM analysis. Middle rows show the EMDs
of all the masked regions estimated with unrevised (row 2) and revised (row 3)
intensities, respectively.
In general, the EMD slope α and the emission measure ratio of hot and warm
plasma can indicate the possible mechanisms responsible for heating the plasma
(low/high frequency nanoflare mechanisms). Both, the revised and unrevised,
EMDs of all the choosen diffuse regions show that the emission measure peaks at
log T(K) = 6.25. The distributions show a monotonic increase from log T(K) =
5.6 to log T(K) = 6.25 and then starts to decrease at higher temperatures.
The unrevised EMDs of the diffuse emission regions show a power law slope
in between 2.3 & 3.5. Implication of the revised radiometric calibration vastly
changed these power law slopes. It produced comparatively shallower slopes
in the range of 1.4 & 2.6 for the diffuse regions and lowered the hot to warm plasma ratio. The EMDs of the core regions, which can only be studied for the
AR 10939, showed consistency with the previous studies on this subject, with
a peak EM at around log T(K) = 6.55.
We assumed the diffuse emission seen above the core in set1 is equivalent
to the diffuse emission present along the line of sight in the studied core re-
gions in set3, i.e., equivalent to the foreground/background emission along the
line of sight. A background/foreground subtraction of an averaged unrevised
and revised diffuse region (Set1) EMDs from the unrevised and revised core
(Set3) EMDs respectively, steepened the slope by approx 0.8 & 0.85. We stress that
this background/foreground subtraction is uncertain due to the unknown variation of the diffuse emission with altitude (both its horizontal line-of-sight depth
and its emissivity). Table 1 shows the average slopes of the EMDs of all the
choosen regions, with and without background/foreground subtraction, for the
AR 10939.
Average power law slopes obtained over different sets of masked regions of AR 10939
|
unrevised |
|
revised |
|
| Masked regions |
no BG |
BG subtracted |
no BG |
BG subtracted |
| set1 |
2.95 |
- |
2.08 |
- |
| set2 |
2.97 |
- |
2.42 |
- |
| set3a |
2.42 |
3.24 |
2.26 |
3.25 |
| set3b |
3.52 |
4.29 |
2.84 |
3.55 |
Conclusion
The characteristic EM distributions of the diffuse emission regions peak at
log T(K) = 6.25. The coolward slopes are in the range 1.4-3.3. This suggests
that both low- as well as high-frequency nanoflare heating mechanisms are at
work. Conparison of the EMDs of topologically different regions, i.e., EMDs of
warm/core loop EMDs with that of the diffuse emission regions, suggests that
the diffuse emission regions are heated and maintained in similar way as the hot
emission in the core of active regions. Our results provide additional constraints
on the properties of these diffuse emission regions and their contribution to the
background/foreground when active region cores are observed on-disk.
References
Srividya Subramanian, Durgesh Tripathi, James A. Klimchuk, and Helen E.
Mason, `Emission Measure Distribution for Di�use Regions in Solar Active Regions', ApJ, 2014, vol 795, pp 76
Del Zanna, G., `A revised radiometric calibration for the Hinode/EIS instrument', A&A, 2013, vol 555, id.A47, pp 20
Next EIS Nugget »» coming later...
TBC
Last Revised: 01-Oct-2014
Feedback and comments: webmaster
|


