The formation and evolution of the NOAA active region 11024 showed a typical emergence pattern.
First, a bipolar axial field slowly appeared on the east limb on 29 June 2009.
Five days later, as a consequence of the buoyancy instability, the main body of the twisted flux tube rapidly emerged through the photosphere as serpentine field lines, developing at the same time a clear magnetic tongue pattern which is indicative of an overall twist (see
Luoni et al. (2011)).
Finally, the magnetic structure progressively simplified, until it was reduced essentially to a bipole by the time the active region had reached the west limb.
Nonlinear force-free field (NLFFF) extrapolation, which provides an approximate reconstruction of the coronal magnetic field based on its footprint at the photospheric level, was used to investigate the structure of the field at the time of the main emergence.
Here, the extrapolation is based on an SOT/SP vector magnetogram obtained from the scan on 4 July 11:58-12:34 UT.
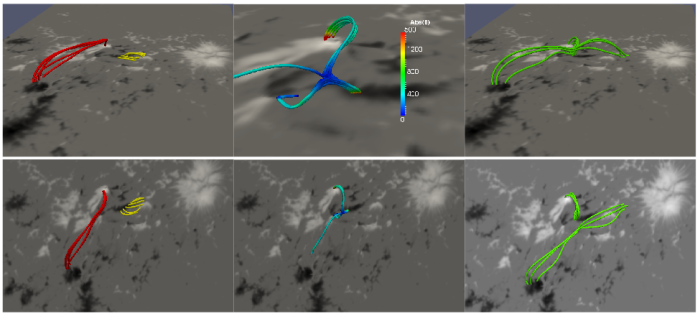
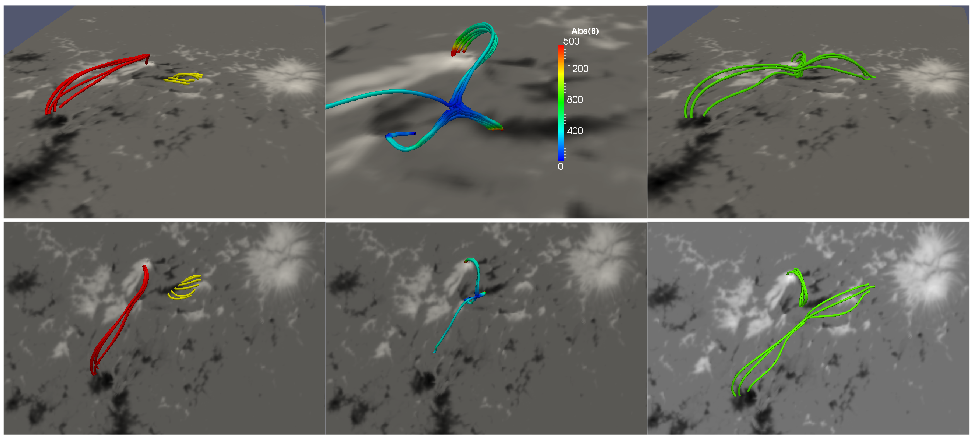
Figure 1: Selected field lines from the NLFFF extrapolation, in three dimensional view (top row) and in projection on the photospheric plane (bottom row, first two panels) or on the SOT image plane (bottom, rightmost panel). Emerging field lines (yellow, left panels) reconnect with field lines connecting the tongues (red, left panels) at the null point (central panels), forming two groups of field lines (green, right panels).
(Click figure to see full-size image)
In particular,
Figure 1 shows a collection of selected field lines highlighting the topological elements that take part in the transformation, due to successive reconnections, of relatively short emerging serpentine field lines (in yellow) into long-range field lines connecting the main polarity concentrations of the AR (in green).
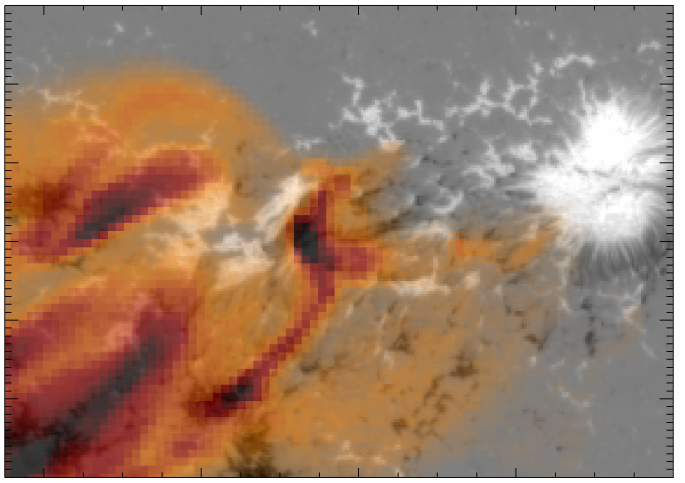
Reconnected field lines (in green in
Figure 1) have a similar extension and shape to the bright loops in the XRT image in
Figure 2.
Such a pattern is repeatedly observed in XRT images over several hours, confirming our assumption that the field structure is well approximated by the NLFFF extrapolation obtained from a single snapshot of the photospheric field taken at a representative time.

Figure 2: XRT image obtained with the Ti poly filter on 4 July 2009 at 11:52 UT, aligned on the SOT/SP LOS image of 4 July 2009 at 11:58 UT, in reversed colour scale.
» (Click figure to see full-size image)
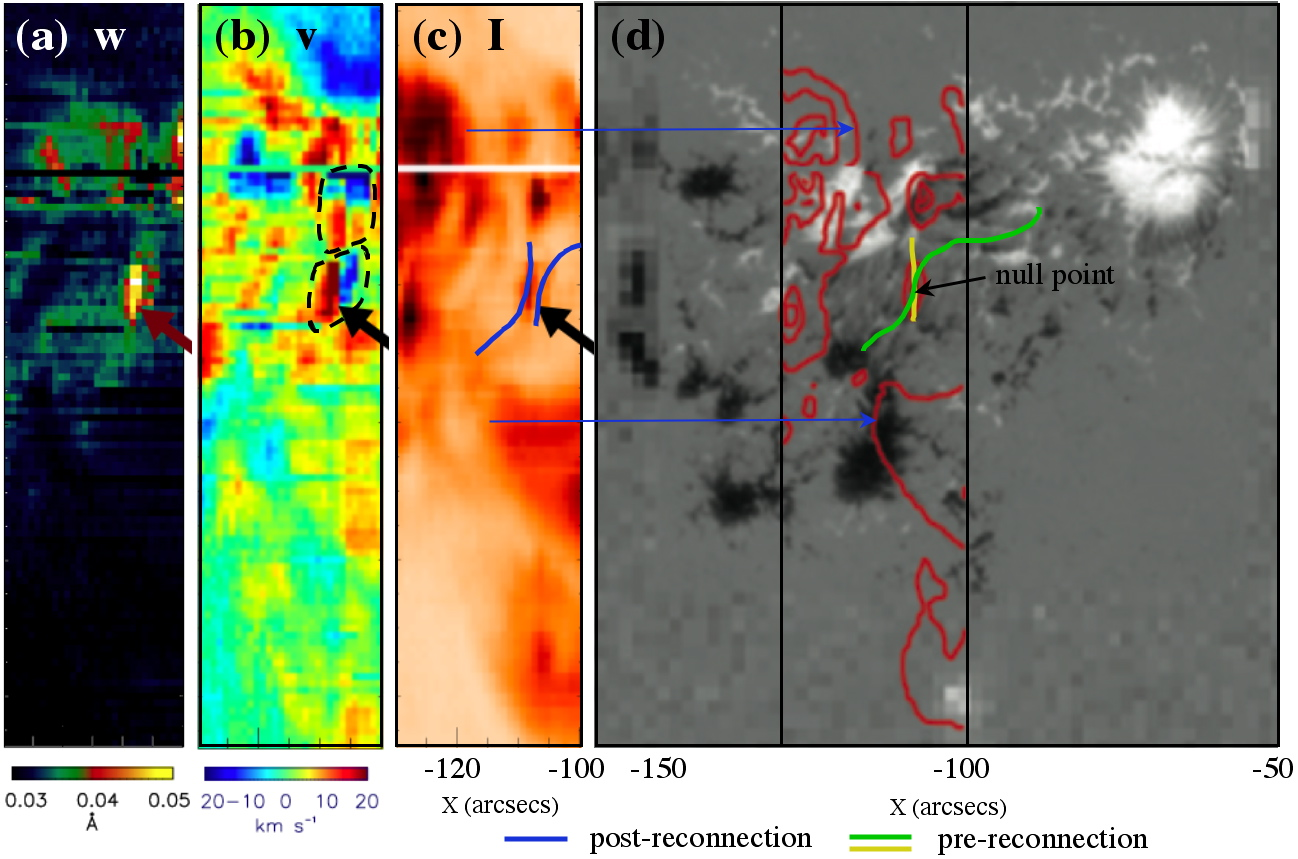
Indications of possible reconnection sites are also obtained from the Doppler velocity map constructed from an EIS raster, roughly co-temporal with the SOT/SP scan.
Beside the typical flows commonly observed in ARs (red-shifted inside and blue-shifted at the edge), such a map shows peculiar dual red- and blue- shifted patterns in the AR core (marked by dashed contours in panel (b) of
Figure 3), with flows up to 20 km/s.
The northern dual feature is located in the proximity of the null point shown in
Figure 1, central panels.
The southern dual feature, marked by a black arrow in panel (c) of
Figure 3, is associated with a large spectral line width, indicating strong turbulence or/and unresolved flow.
This dual feature also corresponds to a null point in the extrapolated field (see
Figure 4).
We therefore propose that the dual velocity features result from magnetic reconnection between field lines connecting pre-existing magnetic concentrations and longer serpentine field lines.

Figure 3: (a) EIS raster, taken between 12:13:55-12:29:44 UT, showing spectral line width in
the Fe XII spectral line. (b) Corresponding EIS raster for Doppler velocity. (c) Corresponding
EIS intensity raster image. (d) SOT magnetogram with EIS intensity isocontours overlaid
(blue arrows show the relationship with panel (c)). In panel (b) the dashed contours indicates
the two dual red/blue-shifted features. In panels (a-c) the location
of the southern dual red/blue-shifted pattern is pointed at with an arrow. In panels (c,d) the
expected post- and pre-reconnection loops are indicated with different colors (see legend at
the panel bottom). Field lines in those panels are drawn by hand on the basis of the field
lines in the actual extrapolated field (see Figure 4), in order to isolate only the most relevant
features.
(Click figure to see full-size image)
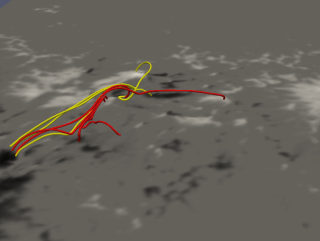 Figure 4
 shows that the two nulls are actually magnetically linked, so both dual velocity features are likely to be related to the same separator-type reconnection.
Figure 4: Selected field lines from the NLFFF extrapolation starting at the null point of Figure 1 (yellow field lines), and at the second null point shown in Figure 3 (red field lines).
» (Click figure to see full-size image)
These are but two examples of locations where reconnection occurs in the corona.
Successive reconnection processes at such locations transform the short serpentine field lines into long-range connectivity across the whole AR (see also the
July 2010 EIS nugget by Louise Harra).
The signature of such reconnection processes is observed by XRT and by an EIS scan showing localized dual blue- and red-shifted velocity features (with large non-thermal line broadening in one case).
All these successive reconnection events eventually lead to the simplified bipolar structure that is observed when the AR reaches the west limb.
References:
For more details see G. Valori, L. M. Green, P. Démoulin, S. Vargas Domínguez, L. van Driel-Gesztelyi, A. Wallace, D. Baker, M. Fuhrmann, “Nonlinear force-free extrapolation of emerging flux with a global twist and serpentine fine structures”, (2011) Submitted to Solar Physics.