The intensity map mode of displaying data averages the line over the line profile. An example of artificial EIS data made by John Mariska from a TRACE image of an active region is displayed below.
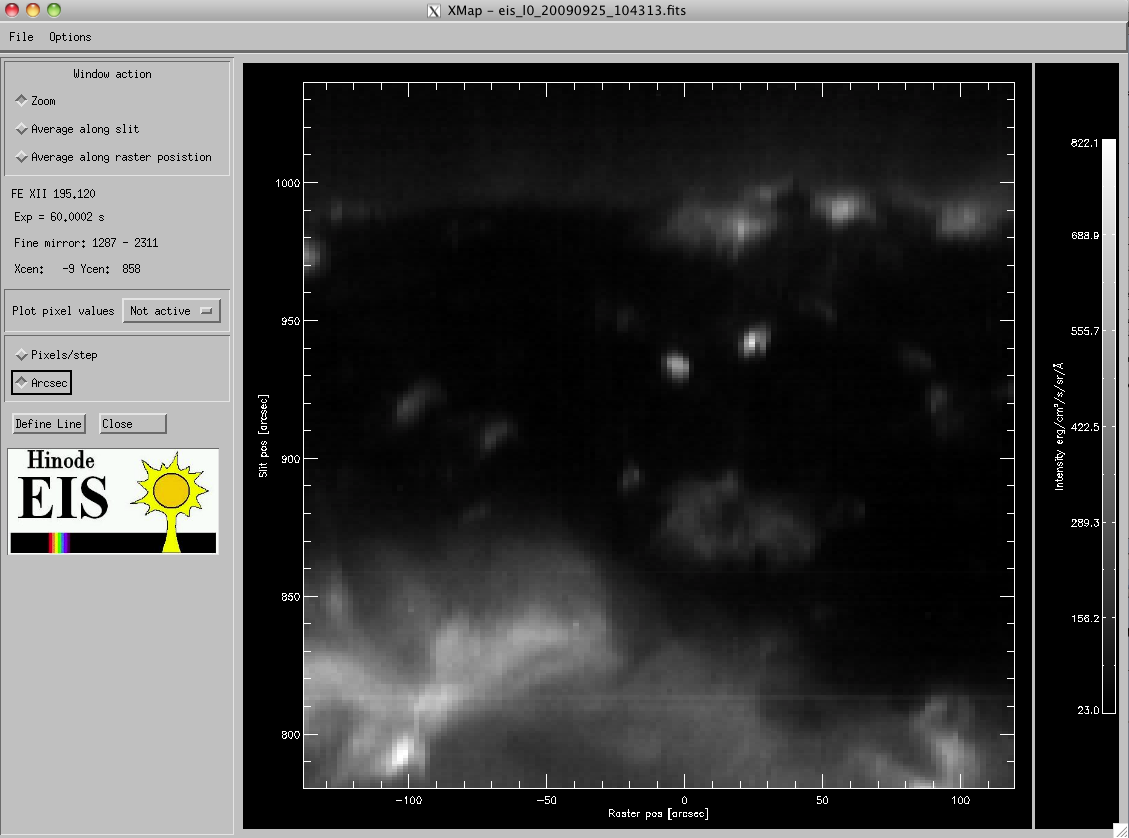 |
If more than one line is selected in xcontrol, several such windows will show up. For a raster containing M slit positions and N exposures, the map will have N x M pixels. For a scanning raster, the N exposures (abscissa) translates into solar-X position, while for a sit-and-stare the corresponding axis dimesnion will be time. The ordinate axis translates to solar-Y.
The menus available to this mode of display are the similar as those described for the xdetector display. In addition, at the bottom of the left column there is a button, Define Line which will allow you to choose which portion of the line profile is to be used for making the image.
