Spectroscopy of very hot pasma in non-flaring parts of a solar limb active region: spatial and temporal properties
S. Parenti, G. del Zanna, A. Petralia, F. Reale, L. Teriaca, P. Testa, H. Mason

In recent years new signatures of coronal heating have been observed: small amounts of very hot plasma (> 5 MK) have been detected in several quiescent ARs (see e.g. Reale 2014 for a review). This detection confirms an earlier conjecture of coronal loops heated impulsively over small (sub-resolution) scales (e.g. Parker 1988; Cargill 1994; Klimchuk 2006, 2015). Such a scenario implies a multi-thermal plasma along the line of sight at larger spatial scales (at the spatial resolution reached by the modern instruments), because of continuous cooling from such a hot state. It is important because it is unique to impulsive heating events: it is the signature of unresolved thin loops (strands) each heated independently over a short time.
Even though this hot plasma has been observed in several non-flaring active regions, at present very little is known about the spatial and temporal distribution within the same active region. In this study (Parenti et al. 2017) we address this issue and to our knowledge, this is the first time that this very hot component is investigated at different heights above the solar limb.
Observations and data reduction
For the first time this type of analysis is carried out by combining the SOHO/SUMER and Hinode/EIS spectra, thus allowing to use iron lines in contiguous ionization stages from Fe X to Fe XIX (i.e., the thermal analysis will be independent of the plasma composition). We observed AR 11459 between the 27 and 28 April 2012, as shown in Figure 1. SUMER ran in sit and stare mode in two off-limb positions, using the 1″ x 300″ slit for about eight hours in each position. EIS scanned 164″ x 376″ around the SUMER slit in about two hours for each of the two SUMER positions using the slit of 2″ and 90 seconds of exposure time. The areas selected for the analysis are marked on the SUMER slit with colored letters.
After the standard data reduction, we performed SUMER-AIA-EIS alignment and we made an investigation of the spatial (Figure 2) and temporal properties of the AR along the SUMER slit in the hot lines. We selected stable structures in the Fe XVIII line during the observation time. In Figure 2, for instance, going from the bottom of the slit (left side of the plot) towards the top, we mark: mask A, one of the faintest and most persistent structures in Fe XVII and Fe XVIII; mask B, located close to the slit centre and outlines a weak area between two bright ones; mask C, the closest to the limb and weakly structured.
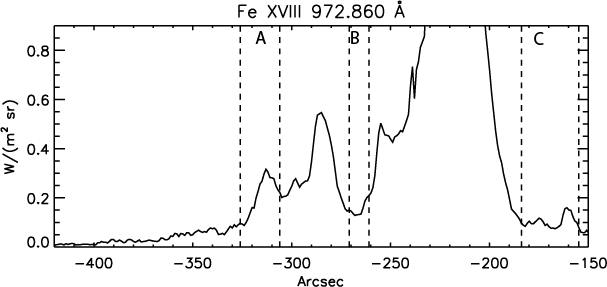
Figure 2: SUMER Fe XVIII intensity along the slit integrated over the sixty exposures. The pairs of vertical dashed lines mark the three areas selected for the analysis.
SUMER-EIS cross calibration
We cross-checked absolute radiometric calibrations of the different spectrometers using the EM loci method. The analysis was done using the CHIANTI v. 8 database and the CHIANTI default ionization equilibrium, with Feldman (1992) elemental abundances.
In addition to the pre-flight analysis, the absolute radiometric calibration of EIS has been investigated post-launch by Del Zanna (2013a), GDZ, and Warren et al. (2014), NRL. Figure 3 shows the EM loci for the EIS data of mask A. There is consistency between the two results (GDZ and NRL), even though the use of the GDZ calibration results in larger EMs than in the NRL case, with a slightly lower peak temperature. In the following analysis we have used the GDZ calibration.
A Ca XIV line is observed by each of the two instruments (943.58Å and 193.87Å). After providing a new CHIANTI model for the SUMER line (943.58Å) we used this couple of lines to cross-calibrate the data (see Parenti et al. 2017 paper for details). We assumed that the observed discrepancy in the predicted EM was due to the SUMER degradation, discussed by Teriaca et al. (2012). Our tests provided a correction factor of 1.8 on the SUMER integrated intensities.
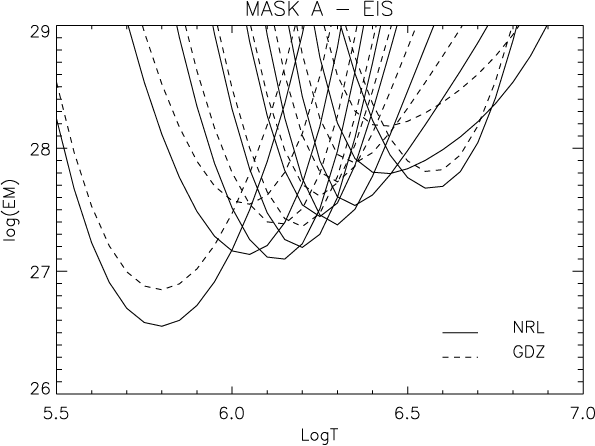
Figure 3: EIS EM loci for mask A using both GDZ (dashed curves) and NRL (solid curves) calibrations. The plotted lines are from Fe X to XVI, Si VII and Ca XIV.
Thermal analysis
After cross-calibration, we performed the thermal analysis using together EIS Fe X-XVI and SUMER Fe XVII-XIX and the two Ca XIV lines. We set upper limits to the EM/DEM analysis by estimating the minimum measurable intensity of flare lines that are not visible in the spectra: Fe XIX 1118.06 in mask B and Fe XXIII 263.765 (EIS) for the other masks.
The EM loci method applied to all the masks shows a first result: from above the limb to about 91 Mm and over about 150 Mm across the AR, the thermal properties above 3 MK are similar almost everywhere (apart from mask B where the hot Fe XIX was not visible).
We applied a modified version of xrt_dem_iterative2.pro DEM inversion routine (Weber et al. 2004) to obtain the curves shown in Figure 4 top. These inversions confirm the finding of the EM Loci analysis showing very similar double peaked DEMs. Some differences are found, but only at high temperatures with a persistent ~10 MK plateau of about 0.1% of the bulk 3MK plasma. Only this high temperature tail can explain the Fe XIX emission.
We also did DEM inversion tests using MCMC method with 200 explorations (batches) of the parameter space, and 200 Monte Carlo realizations for each exploration. The result for mask A is shown in Figure 4 rightbottom, and still predicts a high temperature tail of about 0.1% at ~10 MK of the main bulk plasma.
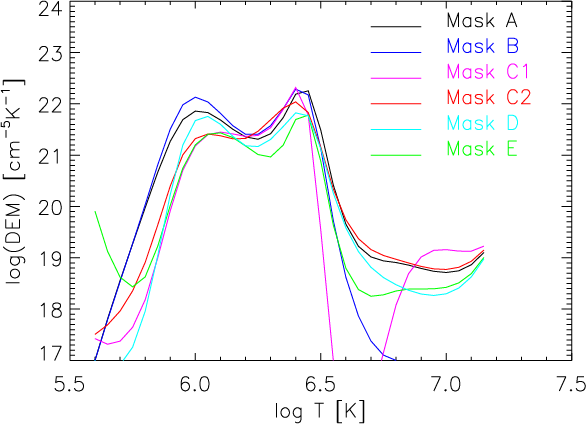
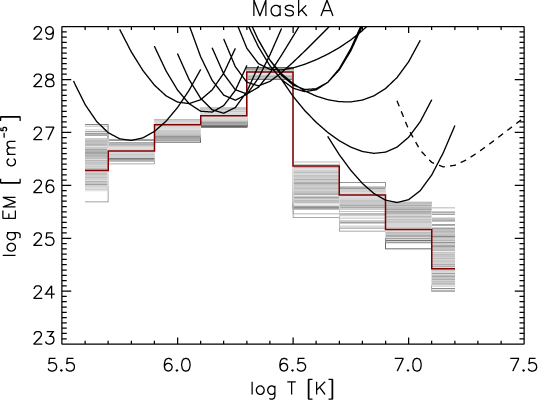
Figure 4: The DEM for all the masks analyzed in this work (top). Bottom: results from the MCMC inversion (red) with their clouds of solutions.
Results
Small amounts of very hot plasma (above 3MK) are present and persistent almost everywhere in the off-limb observations of the AR (from persistent Fe XIX emission). In particular, we measure this up to at least 9.1 Mm above the limb and for 150 Mm across the AR. In the hottest regions we found an EM of about 0.1% at 10 MK with respect to the bulk of the plasma at 3 MK. Very similar DEMs are found almost everywhere suggesting similar thermal properties also over 17th hours of observations.
The link to the paper is here: Parenti et al. 2017:
Spectroscopy of very hot plasma in non-flaring parts of a solar limb active region: spatial and temporal properties
References
Cargill, P. J. 1994, ApJ, 422, 381
Del Zanna, G., & Mason, H. E. 2014, A&A, 565, A14
Klimchuk, J. A. 2006, SoPh, 234, 41
Klimchuk, J. A. 2015, RSPTA, 373, 20140256
Parker, E. N. 1988, ApJ, 330, 474
Reale, F. 2014, LRSP, 11, 4
Teriaca, L., Warren, H. P., & Curdt, W. 2012, ApJL, 754, L40
Warren, H. P., Ugarte-Urra, I., & Landi, E. 2014, ApJS, 213, 11
Weber, M. A., Deluca, E. E., Golub, L., & Sette, A. L. 2004, in IAU Symp. 223, Multi-Wavelength Investigations of Solar Activity, ed. Q3 A. V. Stepanov, E. E. Benevolenskaya, & A. G. Kosovichev, 321
Next EIS Nugget »» coming soon...
TBC
Last Revised: 27-Oct-2011
Feedback and comments: webmaster
|


