Spectroscopic Observations of Current Sheet Formation and Evolution
Harry Warren, David Brooks, Ignacio Ugarte-Urra, Jeffrey Reep, Nicholas Crump, George Doschek
It is widely thought that solar flares are powered by the energy released during magnetic reconnection. In eruptive flares reconnection is believed to occur in the current sheet, the very narrow region where the magnetic field changes sign. Observations of the current sheet hold potential clues as to how magnetic energy is actually transferred to the plasma. At present, however, it is not clear if energy transport occurs through the formation of shocks from field lines retracting away from the reconnection region, the acceleration of particles in the current sheet, the dissipation of waves, or through some combination of these, and perhaps other mechanisms. Observations of the current sheet, particularly spectroscopic observations, have been rare.
On September 10, 2017 Hinode observed an X8.3 flare and coronal mass ejection from NOAA AR 12673 on the west limb of the sun and was able to capture the spectacular current sheet that formed in the wake of this eruption. For this event EIS made unprecedented measurements of the temperature and non-thermal broadening in the current sheet. Combined EIS and AIA observations yielded information on the plasma composition. Papers on the EIS observations for this flare have already been written by Li et al. 2018 (ApJ, 853, 1) and Warren et al. 2018 (ApJ, 854, 2; see link to the paper below). Here we focus on the results from the Warren et al. paper.
A figure movie showing the evolution of the event in AIA/SDO 195 is shown in Figure 1. This sequence shows the eruption of the filament and the formation of a linear, current- sheet-like feature behind the cavity. AIA 193 Å includes contributions from Fe XII and Fe XXIV and shows both the million degree corona and high temperature emission from the flare. Note that these are composite images constructed from combining long and short exposure time images. The boundary between the two can be seen in many of the images. Rasters in the EIS 255.10 Å line are shown in Figure 2.
Figure 1: An AIA 193 movie showing the evolution of the X8.3 flare on Spetember 10, 2017. Note that the wedge-shape emission is signal diffracting from the front entrance filter.
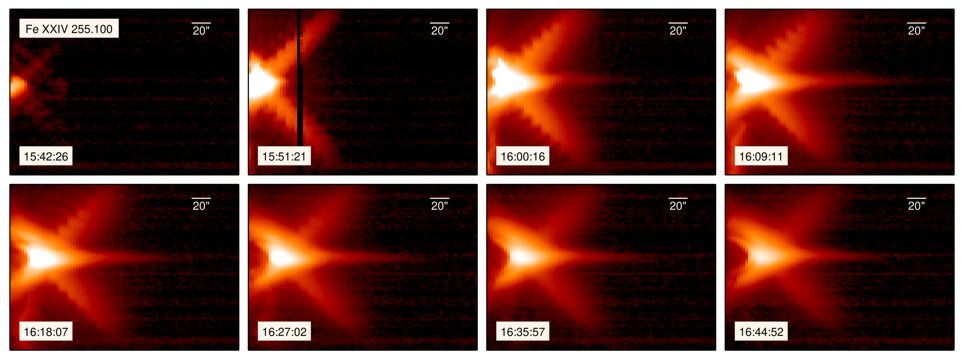
Figure 2: EIS Fe XXIV 255.10 Å rasters as a function of time for the early portion of the flare.
Of particular interest is the temperature in the current sheet. It could be that the release of magnetic energy in the current sheet leads to very strong heating and very high temperatures, and that this energy release powers much of the flare through thermal conduction. Many previous observations with imaging instruments have indicated that the highest temperatures are observed at the largest heights (e.g., Tsuneta et al. 1997), but temperature measurements that extend into the current sheet have been rare.
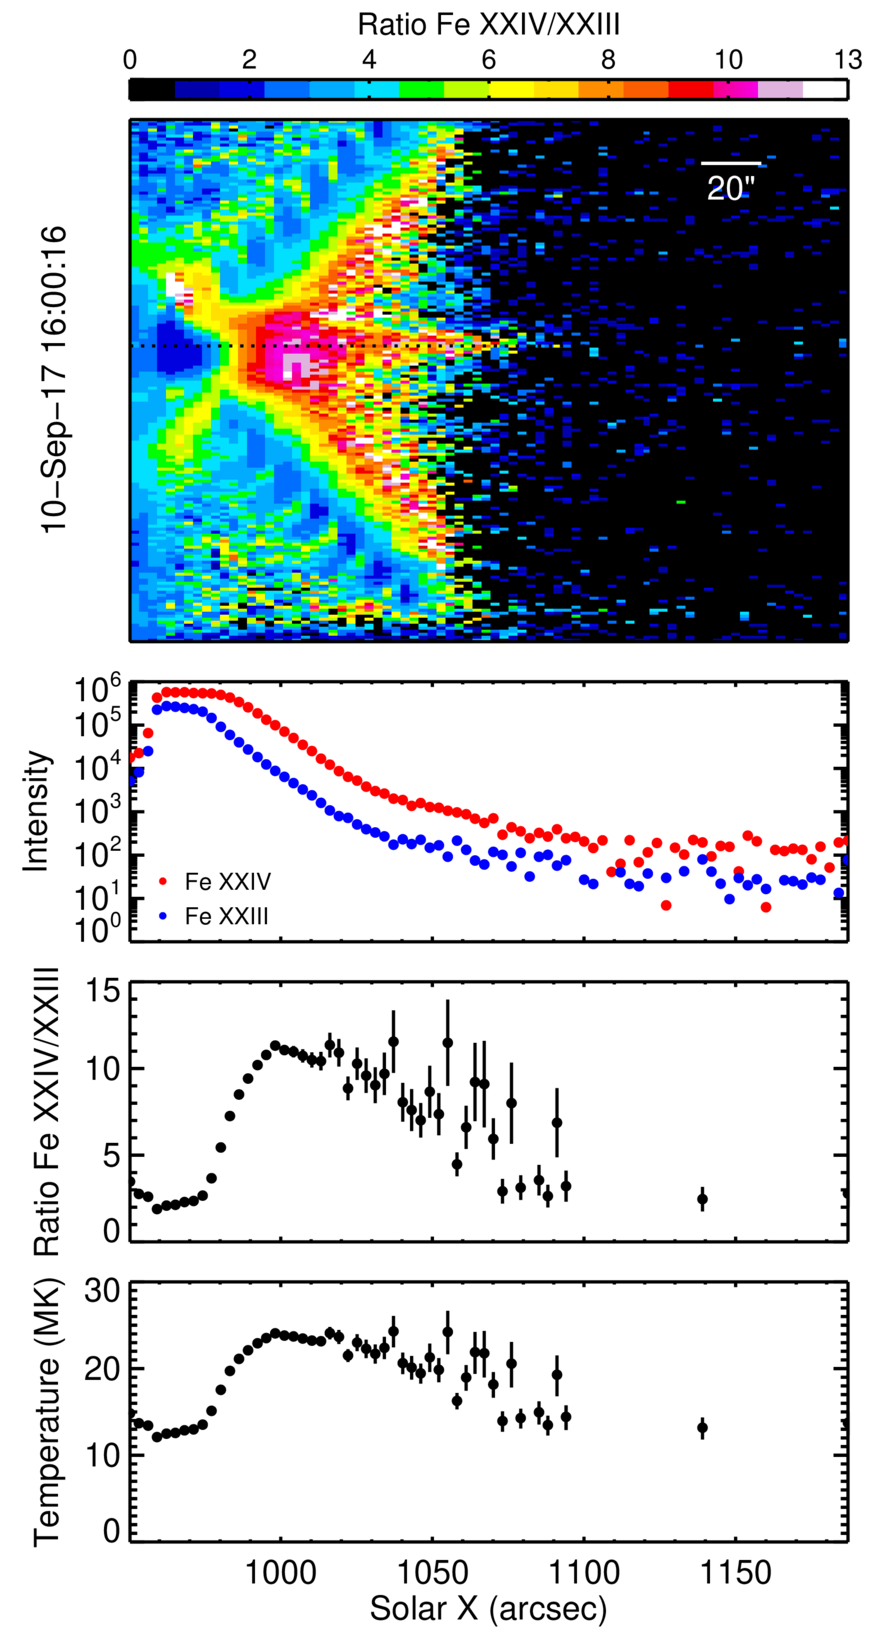
Figure 3: Fe XXIV/XXIII ratios as a function of height for the event. The bottom panels show the intensity, ratio, and ratio temperature with height along the current sheet.
To estimate the electron temperature we use the ratio of EIS Fe XXIV 255.10 to Fe XXIII 263.76 Å, which is sensitive in the 6 to 23 MK range. The intensities, the ratios, and the temperatures derived from the ratios are shown in Figure 3. This analysis clearly shows that the highest temperatures are not observed high in the current sheet, but at lower heights in the region just above the flare arcade. The temperature peaks at about 20 MK and appears to decline with height.
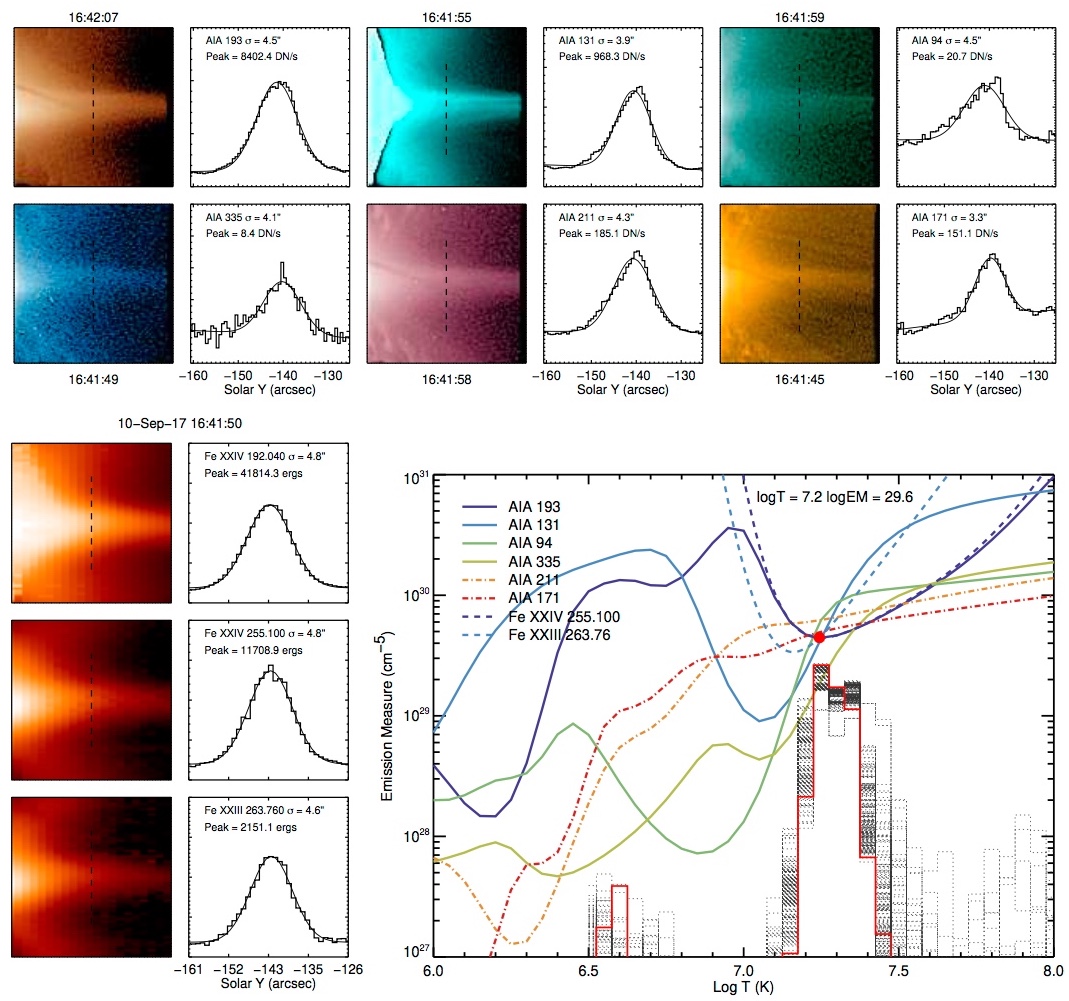
To investigate the temperature structure further we extract the intensities from slices across the current sheet as observed in AIA and EIS. At a given height we fit the intensities across the current sheet with a Gaussian and use the peak. This is shown in Figure 4. The current sheet is surprisingly wide. In all of the AIA channels and EIS lines the sheet has a Gaussian width of about 4.5'' or a FWHM of about 10.6''.
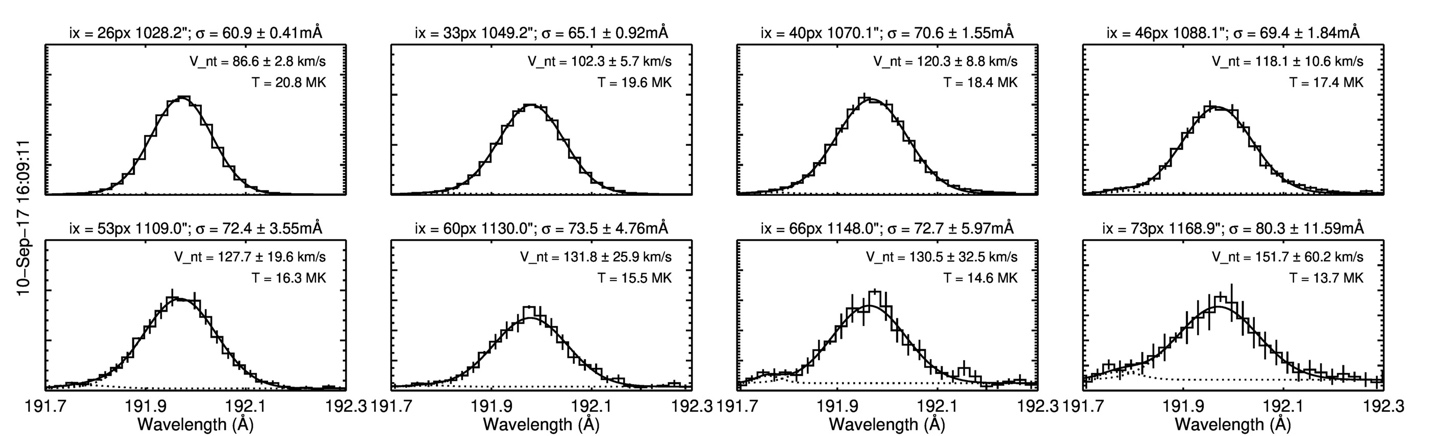
Figure 4: EIS Fe XXIV 192.04 Å line profiles as a function of height in the current sheet. This is for a raster taken early in the event (16:09 UT).
The AIA and EIS intensities can be used to compute EM loci curves, which is the observed intensity divided by the relevant response curve or emissivity. These are also shown in Figure 4 and suggest that the plasma has a relatively narrow temperature distribution. The nature of the temperature distribution can be further refined by computing the differential emission measure distribution (DEM), which confirms that the temperature distribution is narrow. This analysis also suggests a problem with the calibration of the AIA 335 channel, which does not agree with other lines.
Another surprising aspect of the observations is that the current sheet is observed in the AIA 211 and 171 channels. The other AIA channels have contributions from high-temperature emission lines (193 - Fe XXIV 192.04 Å; 131 - Fe XXI 128.75 Å; 94 - Fe XVIII 93.93 Å). At 20 MK the 211 and 171 channels are dominated by continuum emission from thermal bremsstrahlung, which, in contrast to the line emission, is independent of the Fe abundance. The responses have been computed assuming a coronal composition for the plasma, thus the emission measure analysis shown in Figure 4 indicates that the current sheet has a coronal composition.
A final measurement of interest is the non-thermal broadening. Spatially unresolved measurements have shown that the non-thermal broadening almost always peaks very early in an event (e.g., Doschek etal. 1980; Antonucci et al. 1984; Mariska et al. 1993) sometimes before any hard X-ray emission is detected (e.g., Alexander et al. 1998; Harra et al. 2001). The spatial dependence of this non-thermal broadening, however, has been measured only rarely (e.g., Doschek et al. 2014; Hara et al. 2008).
Figure 5: Emission measure analysis of the current sheet. The panels show the intensities across the current sheet at one height. The plot shows the EM loci and DEM.
In Figure 5 we show Fe XXIV 192.04 Å line profiles as a function of height along the current sheet. These data are from a raster taken early in the event. It is clear the profiles become wider with height. Since the temperature is actually decreasing with height, the magnitude of the non-thermal broadening increases dramatically from just above the flare arcade (87 km/s) to the largest heights where we could measure (152 km/s). This trend is evident in subsequent rasters, but the magnitudes systematically decline, consistent with the earlier results.
The analysis of the data from event has revealed some interesting initial results. Future work comparing these observations with numerical simulations would be particularly interesting.
References
Alexander, D., Harra-Murnion, L. K., Khan, J. I., & Matthews, S. A. 1998, ApJL, 494, L235
Antonucci, E., Gabriel, A. H., & Dennis, B. R. 1984, ApJ, 287, 917
Brosius, J. W., & Inglis, A. R. 2017, ApJ, 848, 39
Doschek, G. A., Feldman, U., Kreplin, R. W., & Cohen, L. 1980, ApJ, 239, 725
Doschek, G. A., McKenzie, D. E., & Warren, H. P. 2014, ApJ, 788, 26
Mariska, J. T., Doschek, G. A., & Bentley, R. D. 1993, ApJ, 419, 418
Hara, H., Watanabe, T., Matsuzaki, K., et al. 2008, PASJ, 60, 275
Harra, L. K., Matthews, S. A., & Culhane, J. L. 2001, ApJL, 549, L245
Tsuneta, S., Masuda, S., Kosugi, T., & Sato, J. 1997, ApJ, 478, 787