Plasma diagnostics prior to CME eruptions
by Petros Syntelis

The physical conditions during the pre-eruptive phase of the eruptions are very important in order to understand and model Coronal Mass Ejections (CMEs). For example, whether a flux rope exists or not prior to the eruption, whether and when the plasma is heated, its density, etc., are important parameters that affect the evolution of the system. Many observational works focus on the kinematics of eruptions (see review of Webb & Howard 2012). Only a few number of works provide detailed plasma information about the pre-eruptive phase of CMEs (e.g. Gibson et al. 2002, Harra et al. 2009). In our work, we studied the pre-eruptive plasma parameters of NOAA 11429, which produced two major CMEs, during early March 7, 2012. We used observations taken during March 6, 2012 from SDO/AIA and spectroscopic observations from the EUV Imaging Spectrometer on-board Hinode.
Results
Two flux ropes were found in the active region (AR) prior to the CME eruptions. One was located in the East and one in the West part of the AR (Figure 1). These were observed in all coronal channels of AIA and in many spectral lines (from cold ones, as Fe VIII 186.60Å (logT=5.8), to hot ones, as Fe XXIV 192.06Å (logT=7.25). Here we will focus on the East part only.
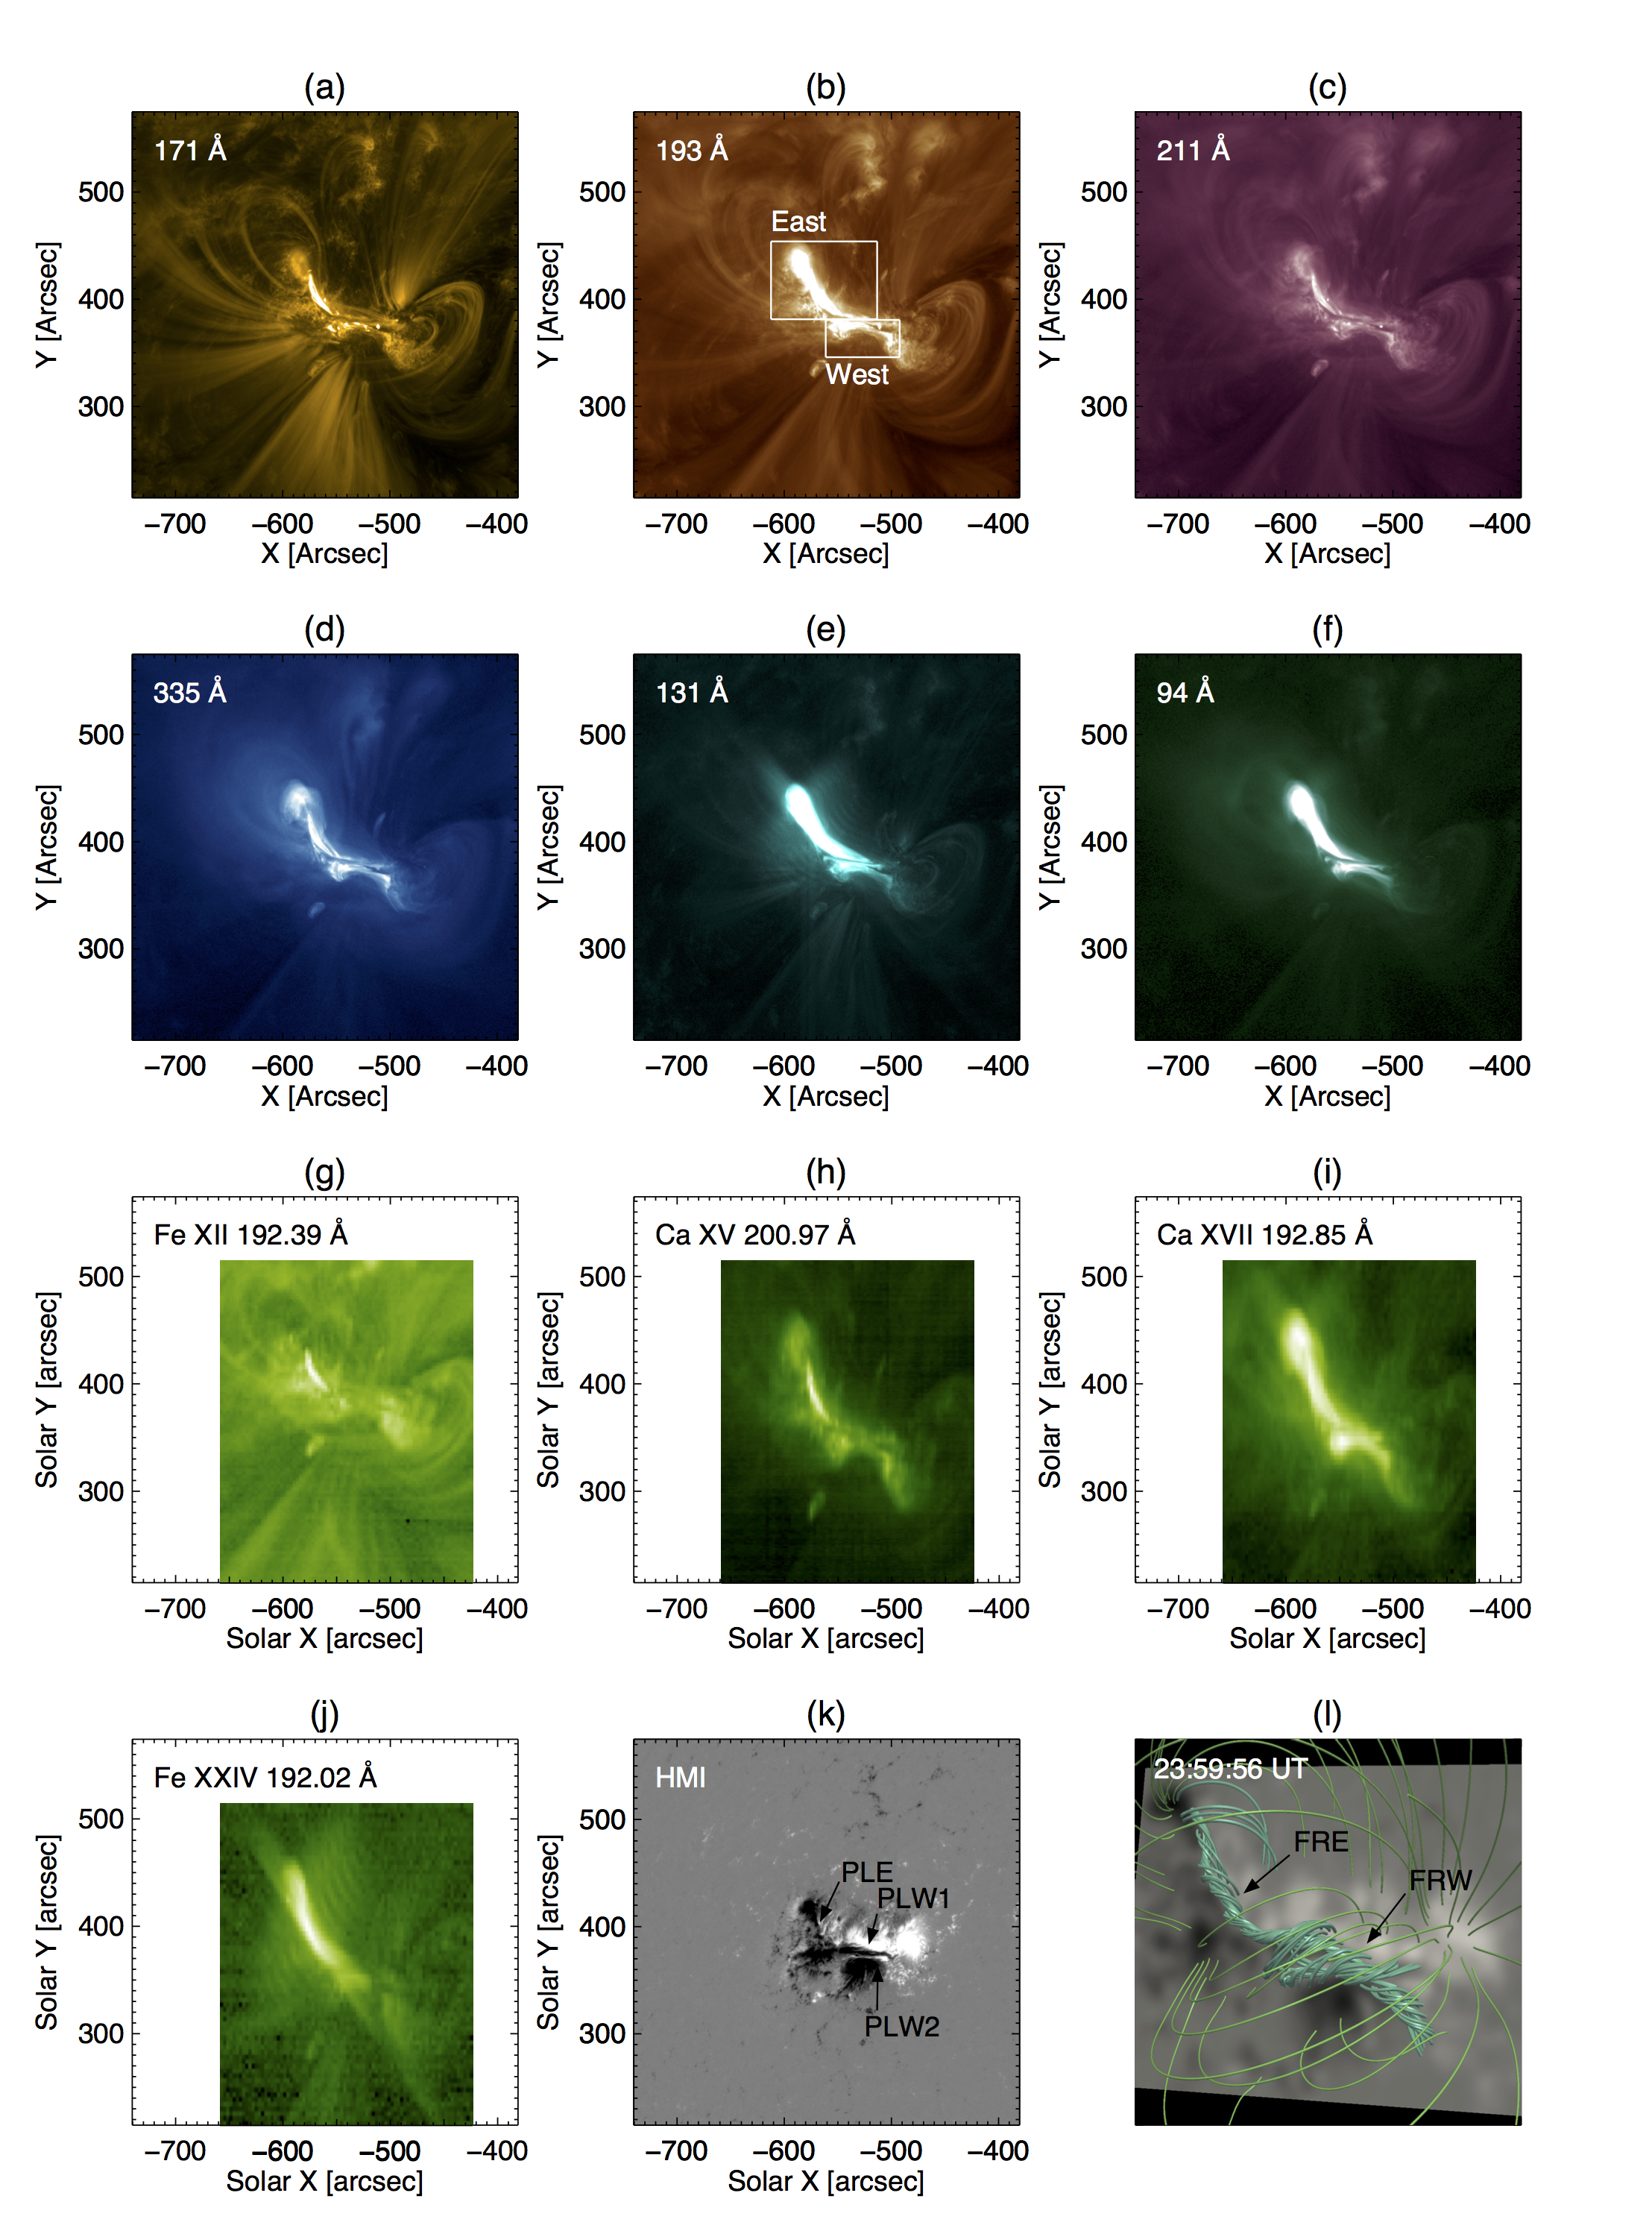
Figure 1: AIA cutout images of the studied AR during March 6, 2012, 12:55 UT shown in (a) 171Å, (b) 193Å, (c) 211Å, (d) 335Å, (e) 131Å, (f) 94Å. The white boxes in (b) define two sub-regions named East and West. (g) EIS intensity image during the 12:47-12:56 UT raster
of Fe XII 192.39Å, (h) Ca XV 200.97Å, (i) Ca XVII 192.85Å and (j) Ca XXIV 192.02Å. Panel sizes in EIS are the same as AIA for better comparison. White spaces in panels (g)-(j) are due to the smaller EIS FoV. (k) HMI line of sight magnetogram. Arrows indicate three PILs, one in the East region (PLE) and two in the West region (PLW1, PLW2). (l) Magnetic field extrapolation at March 6, 23:59 UT showing two flux rope structures, one in the East region (FRE) and one in the West region (FRW), surrounded by an envelope field.
We used intensities recorded by AIA and EIS separately to compute the Differential Emission Measure (DEM) of the flux-rope regions. We compared the more accurate EIS DEM with the one of the AIA to identify the DEM's low-temperature component that corresponds to the AR (logT=6.2-6.4), the high temperature component that corresponds to the FR (logT=6.8-7.2) and the intermediate temperature ranges (logT=6.5-6.7). We then used the high cadence of AIA to produce series of DEMs and took the average value of in the aforementioned temperature ranges (Figure 2). We found that the mean DEM of the high temperature component (red) increases gradually 5h before the onset of the first CME (from 17:00 to 00:00). This was the result of the gradual heating of the FR region (high non-thermal velocities in Ca xv 200.97Å in comparison to Fe XII 192.39Å) and the gradual rise and expansion of the FR (increasing blueshifts in Ca XV 200.97Å and J-map slopes from AIA).
In addition, using Ca XV 200.97Å and Ca XV 181.90Å, we measured electron densities of 4x10^9 to 5x10^10 cm-3. The higher densities (above 2x10^10 cm-3) were found during the flaring events. The lower densities tail (4x10^9 cm-3 to 2x10^10 cm-3) corresponds to the FR.
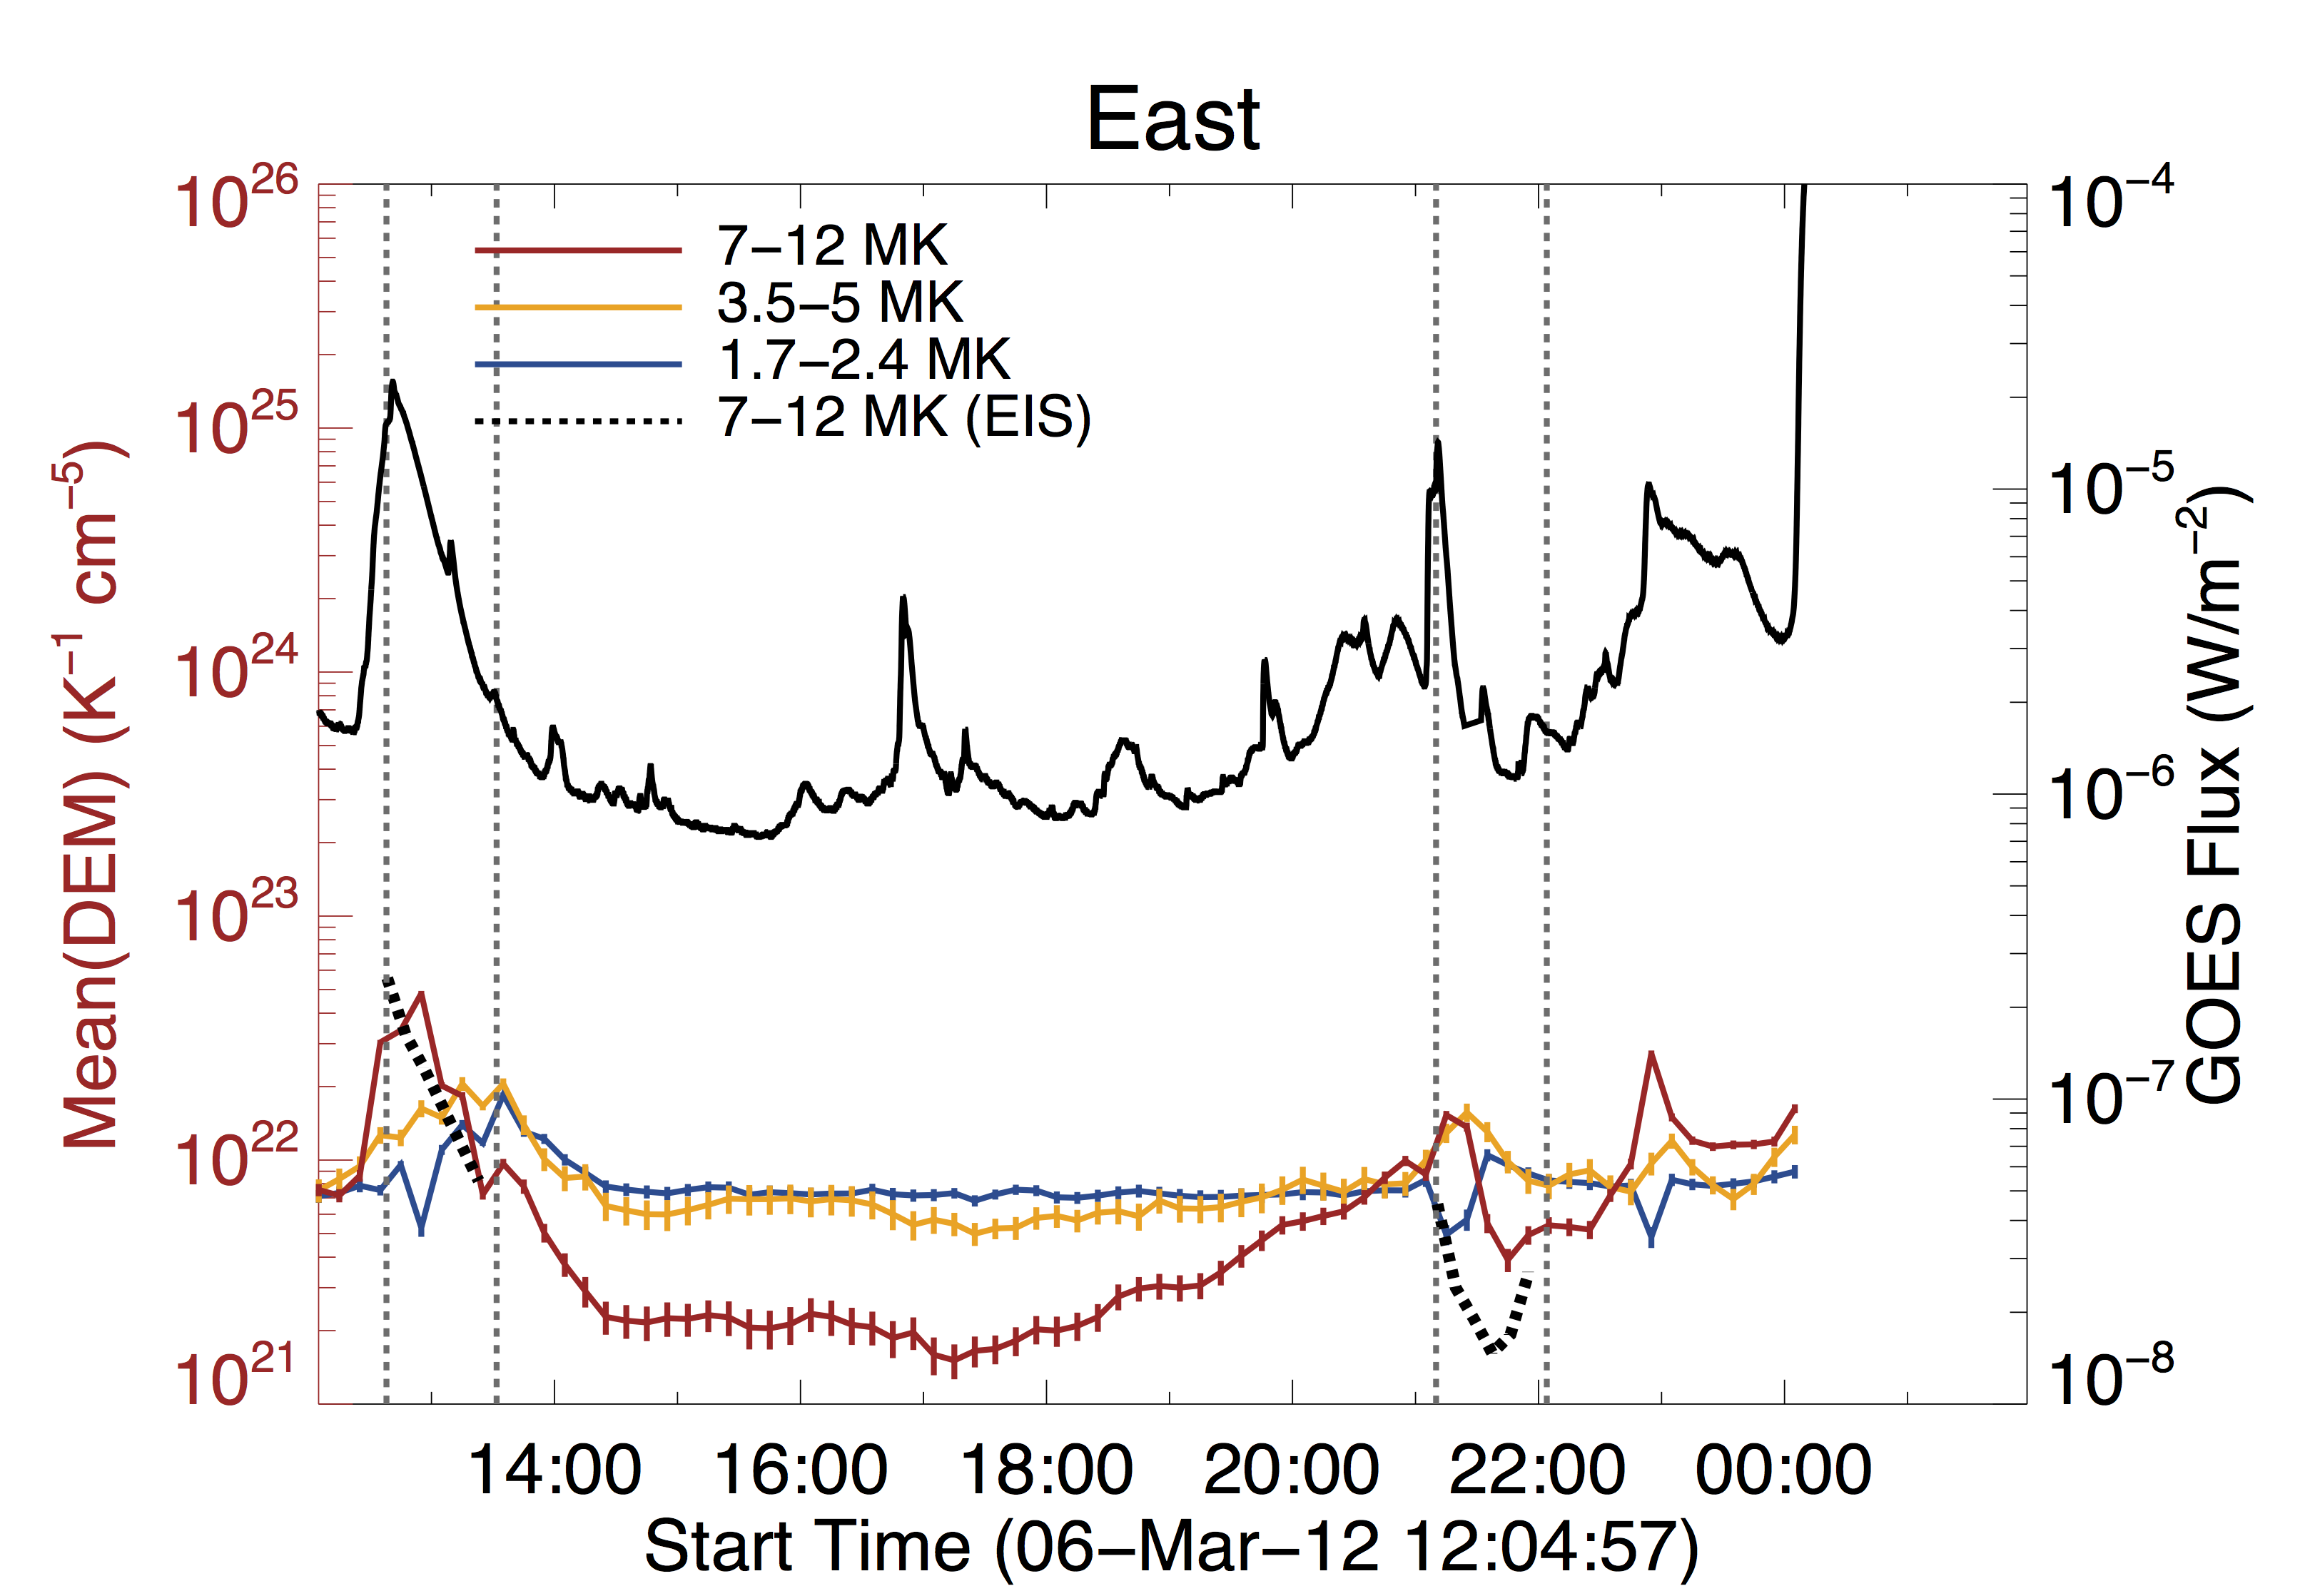
Figure 2: AIA mean DEM timeseries in three temperature ranges 1.7 - 2.4 MK (solid blue), 3.5 - 5 MK (solid orange) and 7 - 12 MK (solid red) for the East region. Black dashed lines indicate the mean DEM from EIS data in the 7 - 12 MK temperature range. The black solid lines show the GOES flux in the 1-8Å channel. The vertical lines show the two time periods of the EIS rasters.
These results were published in Syntelis P., Gontikakis, C., Patsourakos, S., Tsinganos K., 2016, A&A, 588, 16S.
Next EIS Nugget »» coming soon...
TBC
Last Revised: 27-Oct-2011
Feedback and comments: webmaster
|


