What can we deduce from the 3D geometry of AR upflows?
by Pascal Démoulin (Observatoire de Paris, LESIA), Deb Baker (UCL/MSSL), Lidia van Driel-Gesztelyi (UCL/MSSL), and Cristina Mandrini (IAFE)

One of the most intriguing Hinode/EIS results is the detection of high-speed upflows in coronal plasma at the edges of ARs (Doschek et al., 2007; Doschek et al., 2008; Del Zanna, 2008; Harra et al., 2008; Hara et al., 2008). These persistent upflows are located in regions of low electron density and low radiance over strong magnetic flux concentrations of a single polarity. Though the general characteristics of AR upflows are now well-known, key questions remain open - How are these flows oriented? How broad is the angular extent of the flows? Are upflows observed in different spectral lines related? How are they linked? In Démoulin et al., 2013, we attempt to address these questions by analyzing the limb-to-limb evolution of AR 10978 in order to constrain the geometry, nature, and physics of large-scale upflows present on both sides of ARs.
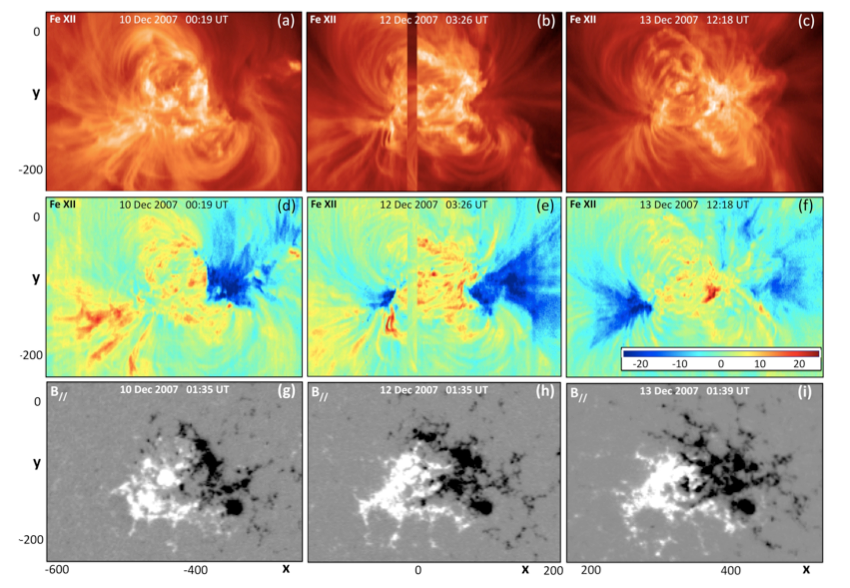
Figure 1: AR 10978 evolution from 10 to 13 December 2007. Top and middle panels - EIS intensity and Doppler velocity maps of Fe XII 195.12 A line. Bottom panel - Corresponding MDI magnetograms with 500 G saturation.
Flow Evolution
Overall, there is a global evolution of upflow velocities observed in AR 10978. On the AR's eastern side, velocities increase with time while the reverse evolution takes place on the AR's western side. The global evolution of upflows is clearly evident in Figure 1 above and in the velocity movie of Si VII 275.35 A, Fe XII 195.12 A, and Fe XV 284.16 A embedded below. (This movie and 5 more movies can be downloaded from http://www.lesia.obspm.fr/perso/pascal-demoulin/13/Movies_Vevol.zip).
We quantify the upflow evolution in the histograms of the upflows in 10 EIS rasters from 9 to 15 December 2007 in Figure 2. Velocities of the eastern upflows show almost continuous increase until early on 15 December before starting to decrease and the evolution on the western side is similar but the change from increasing to decreasing upflow velocities occurs earlier on 11 December. The observed evolution is clear evidence of a projection effect evolving with the AR's position on the solar disk, showing the upflows have a strongly collimated stationary component.
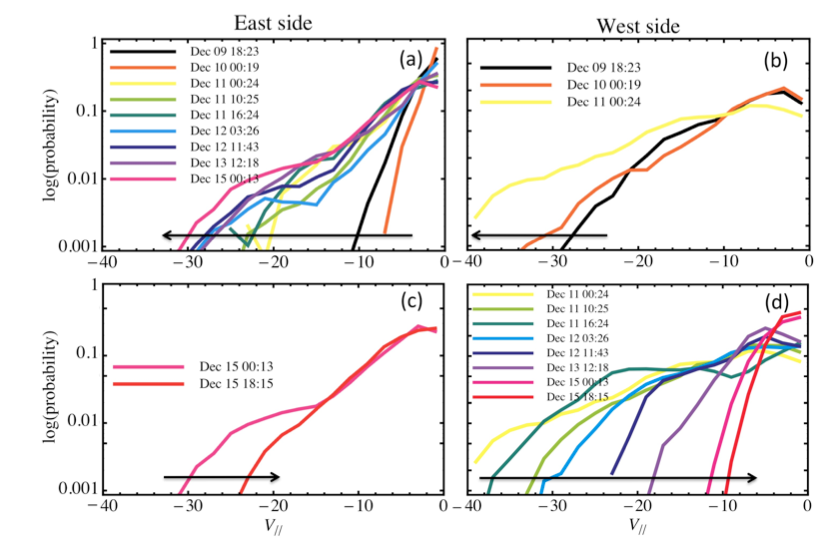
Figure 2: Histograms of Fe XII 195.12 A line upflow velocities on the eastern (left) and western (right) edges of AR 10978. In general, the distributions of upflows show a monotonic evolution as indicated by the thick black arrows.
What are the 3D geometrical properties of the upflows?
A stationary flow model is used to separate apparent velocity evolution due to solar rotation from intrinsic velocity evolution. (See Démoulin et al., 2013 for details of the modelling of steady flows). Once the effect of solar rotation is removed, we are able to determine the inclination and angular spread of the highest upflows in three coronal lines - Si VII, Fe XII, and Fe XV (Log T ~ 5.8, 6.1, and 6.3, resp). The upflows are inclined away from the AR core by -50 +/- 10 degrees in the following polarity and 20+/- 10 degrees in the leading polarity which is consistent with asymmetry in magnetic polarities. Further, the observed velocities are only compatible with a narrow angular spread of upflows with total angular extent less than 30 degrees. This conclusion is stronger on the AR's eastern side where the flows are more stationary, unlike on the western side (leading polarity) where there is a clear intrinsic evolution related to flux emergence. See Figure 3 for a schema showing the inclination and angular spread of the fan-like structure of upflows.
We applied the same stationary flow model analysis to the Fe XII line widths for the same rasters and found a similar dependence to that of Doppler velocity with respect to position on the solar disk. The observed line width of the highest flows follows very well the expected evolution of a stationary flow only affected by projection effects. Remnant line width, independent of the AR's position, is very weak which implies the line width is mainly due to a large dispersion of velocities in the main flow direction. This result provides a reasonable explanation of previous work by Doschek et al., 2008; Hara et al., 2008 and Bryans, Young, and Doschek, 2010 which has shown that line width and Doppler velocity of Fe XII are correlated in AR upflows.
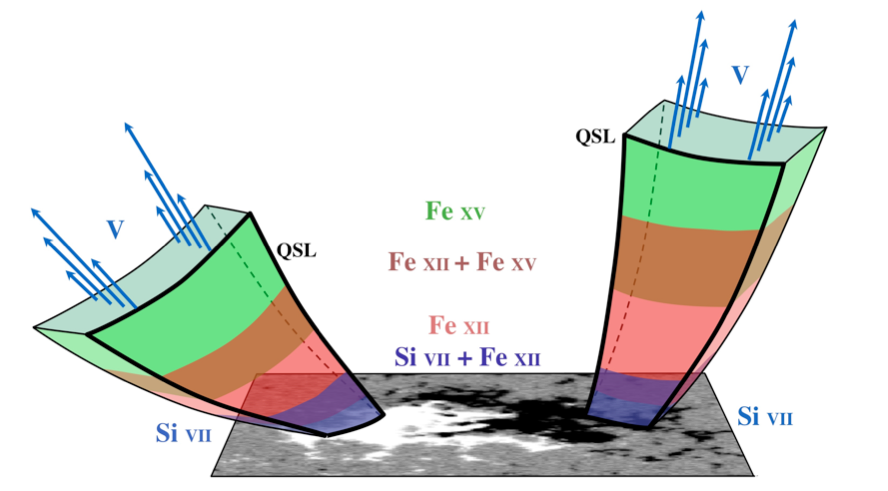
Figure 3: Schema of the upflows on top of a longitudinal magnetogram from a southern view point.
Are upflows observed in different spectral lines related?
The upflows observed in the coronal lines are spatially related with the lower temperature Si VII flows closer to the AR core; the hotter Fe XV flows furthest from the core; and the Fe XII flows in between the other two flows. Figure 4 shows the relative spatial positions of the stationary flows for 12 December at 11:43 UT (top panels) and the apparent evolution of the mean Doppler velocities surrounded by their standard deviation (bottom panels). The temporal evolution of the Doppler velocity and the velocity magnitude of the three spectral lines spanning 0.6 to 2 MK are very similar.
All of these results suggest that we sample the same flows in different spectral lines, therefore different temperatures, at different locations along magnetic flux tubes as shown in Figure 3.
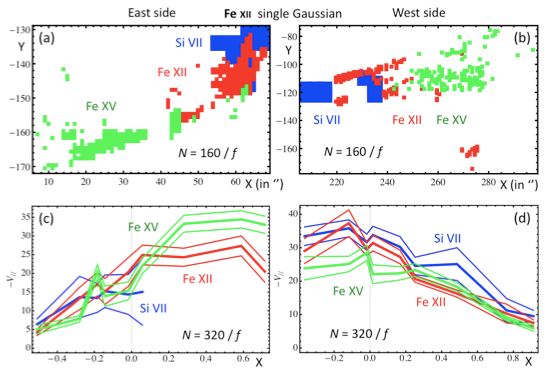
Figure 4: Top panels - Spatial positions of Si VII (blue), Fe XII (red), and Fe XV (green) fastest flows for raster of 12 December at 11:43 UT. Bottom panels - Apparent evolution of the mean fastest flows (thick curves) and their standard deviations (thin curves).
How are the flows linked?
The global picture is one where the same upflows are detected in coronal spectral lines. They flow away from the AR's core along field lines on both sides of the AR within a narrow angular range, hence the fan-like structure, but with a broad velocity range. Though we observe the same flows in different temperature spectral lines, their spatial locations and extents are different due to the temperature stratification of the solar atmosphere and line-of-sight integration of the spectral profiles of varying backgrounds. It is clear from the steady flow modelling that AR upflows have a strong stationary component, suggesting that the driver is acting for extended periods of several days and probably weeks. The location of the flows within the magnetic configuration coupled with their narrow angular extent are compatible with a flow resulting from reconnection at QSLs, including separatrices (Baker et al., 2009; van Driel-Gesztelyi et al., 2012). See Démoulin et al., 2013 for a the details of magnetic field extrapolations and the location of computed quasi-separatrix layers (QSLs) in AR 10978.
We conclude that all the characteristics of the stationary AR upflows are compatible with their generation by magnetic reconnection between dense AR loops and long, low-density loops. A pressure gradient then drives supersonic flows which weaken in magnitude with time. This process is repeated with new loops creating a wide spread of velocities within the upflow regions.
References
---------------
Baker et al., 2009, ApJ, 705, 926
Bryans, Young, Doschek, 2010, ApJ, 715, 1012.
Del Zanna 2008, A&A, 481, L49
Démoulin et al., 2013, Sol. Phys., DOI 10.1007/s11207-013-0234-7
Doschek et al., 2007, ApJ, 667, L109
Doschek et al., 2008, ApJ686, 1362
Harra et al., 2008, ApJ,676, L147
Hara et al., 2008, ApJ, 678, L67
van Driel-Gesztelyi et al., 2012, Sol. Phys.,281, 237
Next EIS Nugget »» coming in May, 2013
TBC
Last Revised: 25-Sep-2012
Feedback and comments: webmaster
|


