Spatio-temporal dynamics of magnetic flux tubes in the photosphere of the Sun are thought to be the driving mechanism for energy build-up and release that occurs in the upper solar atmosphere. Plasma flows, in the photosphere and below, transport magnetic flux tubes thus creating a complex magnetic topology in the corona, which results in flares of all scales, as well as in heating of the corona. In this work we explore the changes in the magnetic field and the impact in the corona through measurements of non-thermal velocity.
We analyzed Solar Dynamics Observatory (SDO) line-of-sight magnetograms for a decaying NOAA active region (AR) 11451 along with co-temporal extreme ultraviolet imaging spectrometer (EIS) data from the Hinode spacecraft. The photosphere was studied via time variations of the turbulent magnetic diffusivity coefficient and the magnetic power spectrum index through analysis of magnetogram data from Helioseismic and Magnetic Imager (HMI) data. These measure the intensity of the random motions of magnetic elements and the state of turbulence of the magnetic field, respectively. The time changes of the non-thermal energy release in the corona was explored via histogram analysis of the non-thermal velocity, in order to highlight the largest values at each time which may indicate an increase in energy release in the corona. We used the 10% upper range of the histogram of non-thermal energy of the coronal spectral line of Fe XII 195A. A two-day time interval was analyzed from HMI data, along with the EIS data for the same field of view (see Figure 1). The active region is decaying which can also be seen from Figure 2 as there is a steady decrease in both magnetic flux and in the coronal intensity. There were no significant periods of activity during our observations.
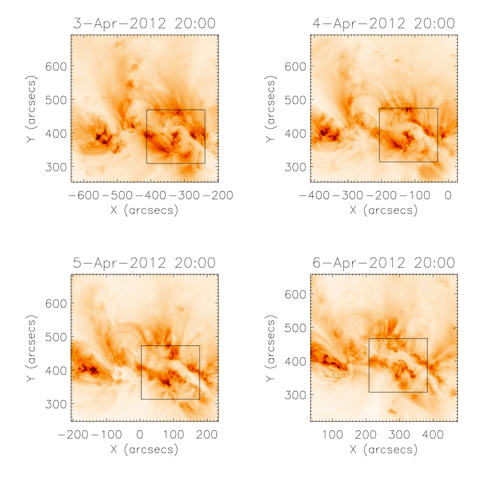
Figure 1: The AIA 193A data for the active region with the black box showing the EIS field of view.
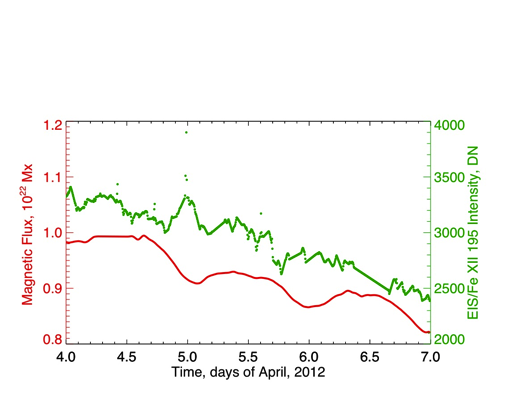
Figure 2: The magnetic flux and the coronal intensity during the period analysed.
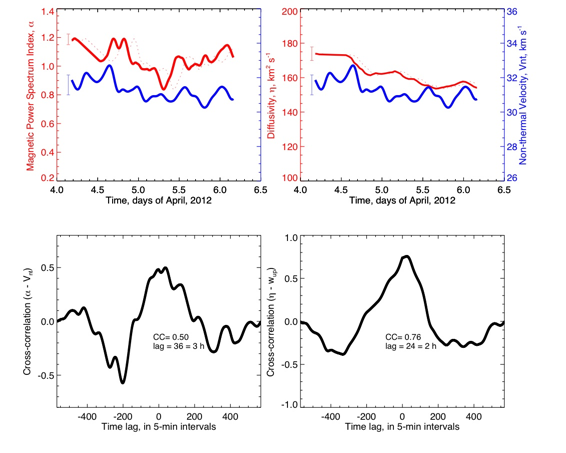
Figure 3: Top - Fe XII 195A non-thermal velocity (blue line in both frames, right axis in the right frame), magnetic power spectrum index, (red, left frame), and magnetic diffusivity coefficient, (red, right frame) as a function of time. Dotted red lines show shifted to the right magnetic data: 3-hour shift for magnetic power spectrum index and 2-hour shift for magnetic diffusivity coefficient. Bars show one standard deviation of data points. Smoothed data curves are shown. Bottom - Cross-correlation functions magnetic power spectrum index - non-thermal velocity (left) and magnetic diffusivity coefficient - non-thermal velocity (right). The maximum correlation coefficients, CC, and corresponding time lags are shown.
Our main findings are:
1. The magnetic turbulent diffusion coefficient precedes the upper range of non-thermal velocity with the time lag of approximately 2 hours and the cross-correlation coefficient of 0.76.
2. The power-law index of the magnetic power spectrum precedes non-thermal velocity with a time lag of approximately 3 hours and the cross-correlation coefficient of 0.5.
The data show that the magnetic flux dispersal in the photosphere is relevant to non-thermal energy release dynamics in the above corona. The results are consistent with the nanoflare mechanism of the coronal heating, due to time lags being consistent with the process of heating and cooling the loops heated by nanoflares.
This paper has been accepted by ApJ. The research leading to these results has received funding from European Commission's Seventh Framework Programme under grant agreement No. 284461 (eHEROES project).


