Hinode/EIS Nugget – EIS intensity and dopplergrams used to compute the true shape of active region loops
by Costis Gontikakis, Research Center for Astronomy and Applied Mathematics, Academy of Athens
Introduction:
The study of coronal loops is an important step in understanding the physics of the solar corona. The knowledge of the loops' 3D shape is valuable information to understand plasma flows and thermodynamics along them, and works as a constraint in the shape of the active region magnetic field topology. Efforts to understand the 3D shape of coronal loops from their appearance in intensity images and in dopplergrams were also done in the past (Loughhead et al 1983). In this study, presented in detail by Syntelis et al. (2012), we analyzed intensity images and dopplergrams recorded by EIS on 3 December 2006 over Active Region 10926, located at (400 arcsecs, -200 arcsecs) from the solar disk center.
Observations:
EIS, on 3 December 2006, recorded the spectral lines Fe VIII 185 Å, Fe X 184 ,Å Fe XIII 202 Å, and Fe XV 284 Å, over AR 10926 during two rasters: Raster 1 had a duration from 15:32:19 UT until 17:46:31 UT while Raster 2, had a duration from 19:10:49 UT until 23:49:06 UT.
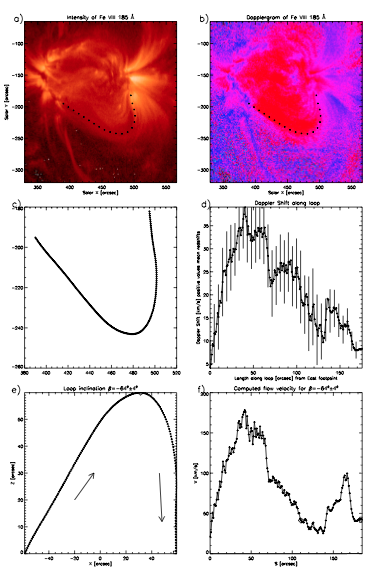
Figure 1
A method to deduce loops inclinations:
In the first row of Figure 1 we see the intensity image and the dopplergram (panels a and b, respectively) of the Fe VIII 185 Å spectral line, formed at plasma temperatures of 400000 K. In both images a loop is sampled from footpoint to footpoint using cross symbols. Panel c) of Figure 1 shows the loop shape as it appears in the intensity and dopplergram images with more sampled points. Panel d) shows the Doppler shifts measured at each dopplergram pixel, along the loop, as a function of the loop distance from the eastern footpoint. The velocity error bars are calculated from the uncertainty of the Gaussian fit used to derive the Fe VIII 185 Å Doppler shift. To these error bars one should also add a systematic uncertainty produced by the zero point of the dopplershift which is of the order of 5 km/s (Del Zanna 2008). Supposing that the footpoint positions are fixed on the solar surface and that the loop is defined in a single plane, we can define a family of loops having the same projection on the plane of the sky as in panel c). Moreover, the plasma flow V along these loop axes has the same projection on the line of sight as the Doppler shifts measured in panel d). These loops are parametrized by the inclination angle β, defined between the loop plane and the normal to the solar surface. The mathematics of the model are described in Alissandrakis et al (2008). In the present model, β is constrained by the requirement that V is continuous along the loop, without sharp peaks and discontinuities along the loop's length.
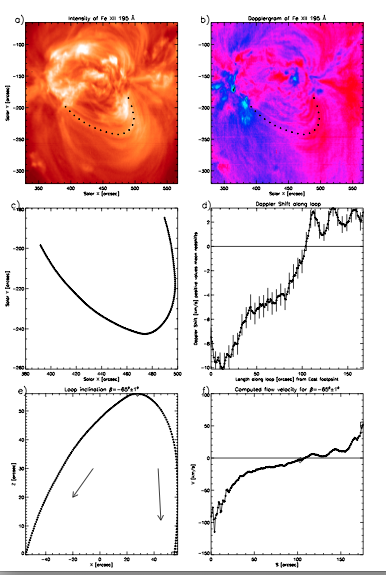
Figure 2
For the loop of Figure 1, the best inclination choice is β =(64 +/- 4) deg, that gives a continuous V-function along the loop. Panel e) shows the loop shape in coordinates X, Z along the plane of the loop. Panel f) shows the computed velocity along the loop's axis. A negative inclination means that the loop is inclined towards the solar south pole. In panel f), positive velocities mean motions from the eastern (left) footpoint towards the western (right) one. Therefore, panel f) shows plasma motions from the eastern towards to western footpoint. The same is shown with arrows in panel e). Figure 2 demonstrates the application of the method for the same loop morphology recorded in the Fe XII 195 Å line. Panels a), b) and c) show the intensity image, the dopplergram, and the loop shape projected on the plane of the sky as in Figure 1. Panel d) shows the Doppler shift along the loop that now includes negative and positive values (blue and red shifts respectively) along the loop. The best solution for this loop gives an inclination of ( -65 +/-1) deg. This inclination is similar to the one we found with the Fe VIII 185 Å line. In panel e) the flow seems to drain from the loop top towards the footpoints.
Conclusion:
The results from all analyzed loops in the Syntelis et al (2012) paper suggest that loops sharing roughly the same morphology, when observed in different spectra lines, have different dynamical behavior ranging from unidirectional flows with different orientations, to draining motions. This suggests that we observe different loop strands having similar morphologies but perhaps different dynamic and thermodynamic states. This being said, we cannot rule out the influence of the background light emitted along the line of sight. This work was possible thanks to the systematic study of active regions using the EIS telescope in many spectral lines with high spatial and spectral resolution.
References:
Alissandrakis, C.E., Gontikakis, C., Dara, H.C., 2008, Sol. Phys., 252, 73Loughhead, R.E., Wang, J.-L., Blows, G.: 1983, ApJ, 274, 883Del Zanna, G., 2008, A&A, 481, 49Syntelis, P., Gontikakis, C., Georgoulis, M.K., Alissandrakis, C.E., Tsinganos, K., 2012, Sol. Phys., in press.
Next EIS Nugget »» coming in July, 2012
TBC
Last Revised: 27-Oct-2011
Feedback and comments: webmaster
|


