The spectroheliogram way of displaying the data is displayed below. It is launched by clcking the corresponding button in the XCONTROL window, if one or more line windows have been selected from the list.
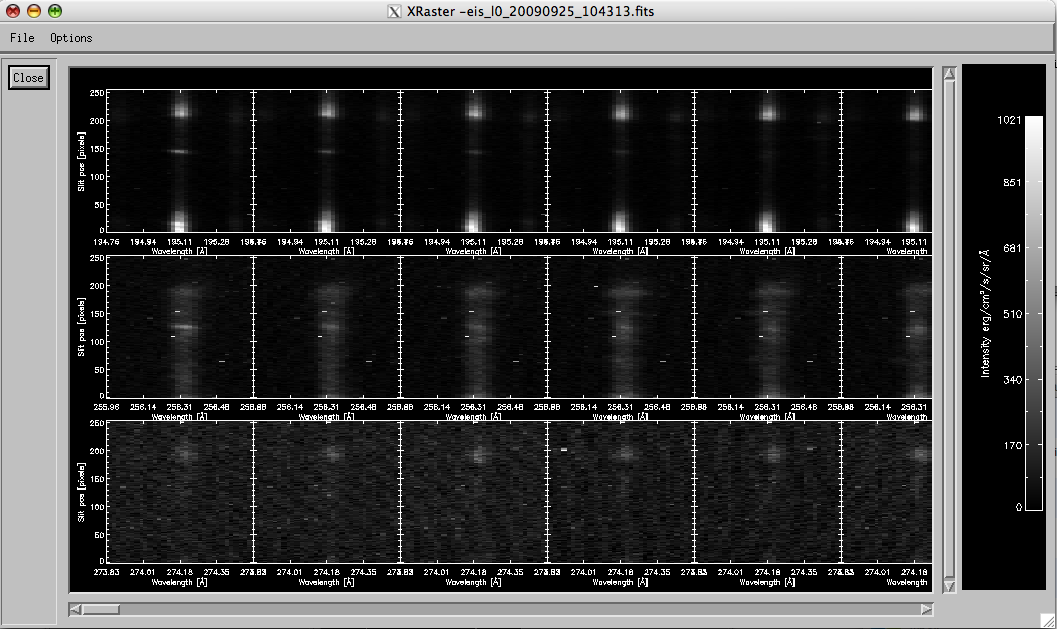 |
The spectroheliogram image shows line count rates as a function of wavelength (abscissa) and slit position (ordinate). The top row shows N number of images for the N exposures in the raster for the first selected line. Second row shows images for line number 2 etc. In this case there are 4 lines selected and 3 exposures in the raster.
The menus are the same as those described for the Xdetector display.
put your CopyrightNotice in here !