EIS_RASTER_BROWSER#
This widget-based routine can be accessed through XCONTROL or via the IDL command line, e.g.,
IDL> eis_raster_browser, filename
where filename can either be the name of a level-0 or level-1 FITS file, or it can be an EIS data object.
An example widget display is shown below.
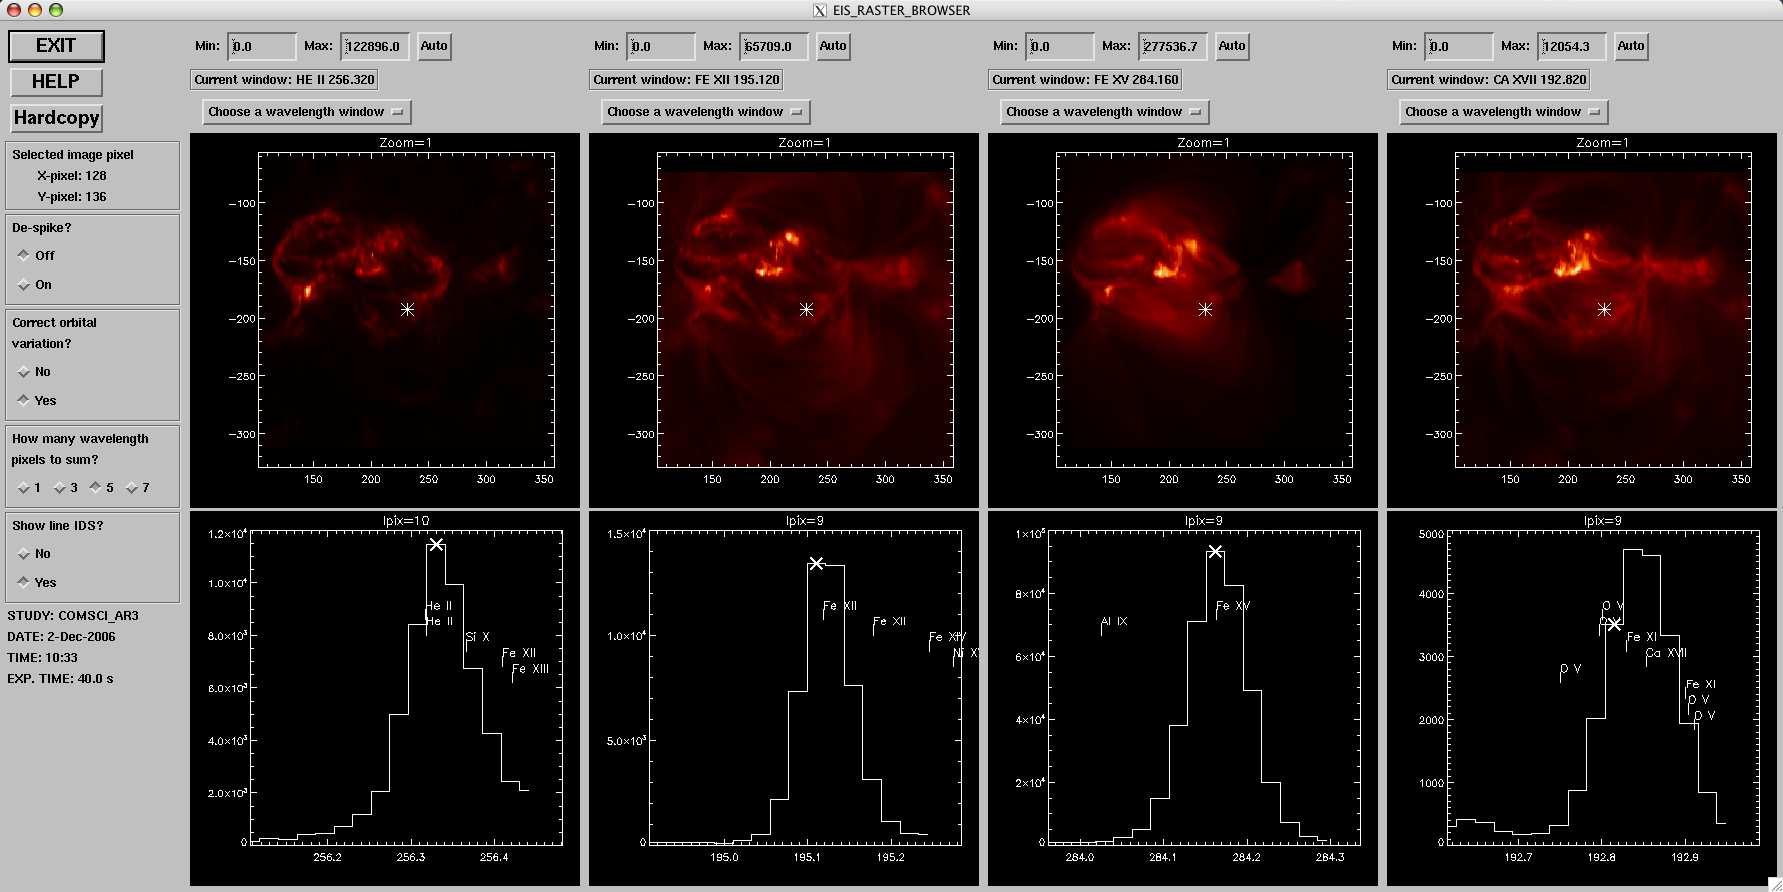 |
The main aim of eis_raster_browser is allow the user to view the 3D data cubes (wavelength, Solar-X, Solar-Y) that EIS typically generates in an intuitive way.
There are four graphics windows at the top showing images in different emission lines. On each image is shown a star that picks out a pixel in the image. The spectrum at this pixel is shown in the lower graphic window.
For the spectrum windows, a 'X' symbol denotes the wavelength pixel from which the image is formed.
The user can change the selected spatial and wavelength pixels by using the MIDDLE mouse button. Try clicking on a feature in one of the images. You will see that the spectrum window changes to show the spectrum of the new pixel. Note that the other windows also show the spectra of the new pixel.
Now click with the middle button on one of the spectrum windows. You will see that the image above the spectrum will change to reflect the new wavelength pixel.
To zoom into the image or spectrum plots click with the LEFT mouse button. To zoom out, click on the RIGHT mouse button.
By default eis_raster_browser tries to show images in the 3 core EIS lines (He II 256.32, Fe XII 195.12 and Ca XVII 192.86) and Fe XV 284.16. If any of these are not available then the routine starts with the 1st spectral window and works upwards until all four windows are filled.
The user can control which windows are shown through drop-down lists above each image display ('Choose a wavelength window').
The intensity scaling for the windows can be adjusted through text boxes that control the minimum and maximum values of the display. This is mainly useful for bringing out weak features.
There are four options available through widgets on the left of the GUI:
- De-spike? This is intended to be used for level-0 data that have not been cleaned of warm pixels and cosmic rays. If you are viewing level-1 data, then you do not need to use this option.
- Correct orbital variation? The position of the EIS emission lines on the detector varies with time and by selecting this option the chosen wavelength pixels in the plots are automatically adjusted for this orbit variation. This option is on by default.
- How many wavelength pixels to sum? To avoid sampling just a single wavelength pixel, this option allows you to bin several wavelength pixels to form an image. The default is 5.
- Show line IDs. The EIS software stores a list of the major lines observed by EIS and this option forces raster_browser to read the list and show the line IDs on the spectral window. The position of the ID text will not necessarily the line position due to Doppler shifts and/or the orbit variation.